question 1 is 8, question 2 is 9, question 3 is 24
step-by-step explanation:
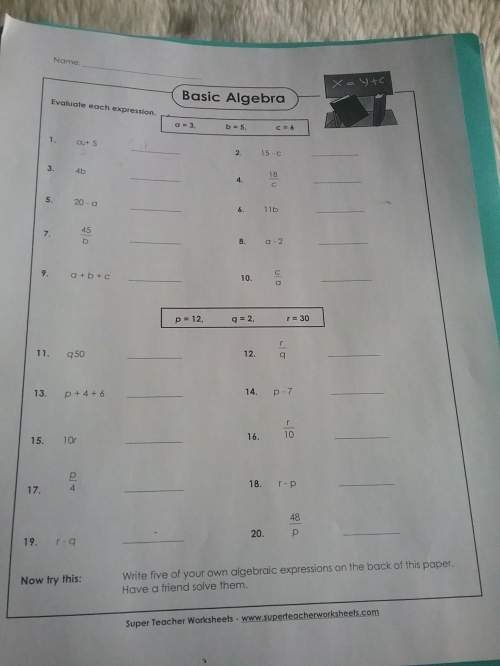
now, the numbers they give you at the top are the key. from there, you just have to plug and chug! let's try 1, 2, and 3!
key: a=3, b=5, c=6
1. a+5
remember, a=3, so we plug that in to get 3+5=8
2. 15-c
c=6, so we plug that in to get 15-6=9
3. 4b
b=6, so we plug it in to get 4*6=24
time to try the rest on your own! if you put the answers below in a comment, i'll check them for you!