
Mathematics, 05.06.2021 05:00 nkazmirski3229
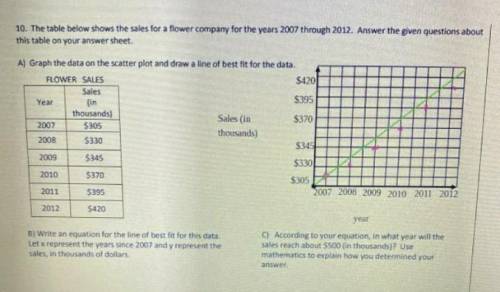
10. The table below shows the sales for a flower company for the years 2007 through 2012. Answer the given questions about this table on your answer sheet.
A) Graph the data on the scatter plot and draw a line of best fit for the data.
(I already answered A)
B) Write an equation for the best fit for this data. Let x represent the years since 2007 & y represent the sales, in thousands of dollars.
C) According to your equation, in what year will sales reach $500 (in thousands) Use mathematics to explain how you determined your answer.

Answers: 3
Another question on Mathematics
Mathematics, 21.06.2019 15:30
Michelle had a birthday party. she bought a bag of candy with 96 starbursts, 72 hershey's, and 68 reese's. she wants to use all the candy she bought to make goody bags with the same amount of starbursts, hershey's and reese's in each bag. what is the largest number of bags she can make?
Answers: 1
Mathematics, 21.06.2019 20:00
Can you me find the missing length. i attached an image.
Answers: 1
Mathematics, 21.06.2019 20:50
What is the 9th term in the geometric sequence described by this explicit formula? an=-6. (2)(n-1) apex
Answers: 2
You know the right answer?
10. The table below shows the sales for a flower company for the years 2007 through 2012. Answer the...
Questions

Biology, 06.10.2019 03:40


Mathematics, 06.10.2019 03:40

Mathematics, 06.10.2019 03:40

History, 06.10.2019 03:40

Mathematics, 06.10.2019 03:40
Social Studies, 06.10.2019 03:40

Social Studies, 06.10.2019 03:40

Mathematics, 06.10.2019 03:40
Mathematics, 06.10.2019 03:40


