Mathematics, 09.06.2021 16:50 kanyewest27
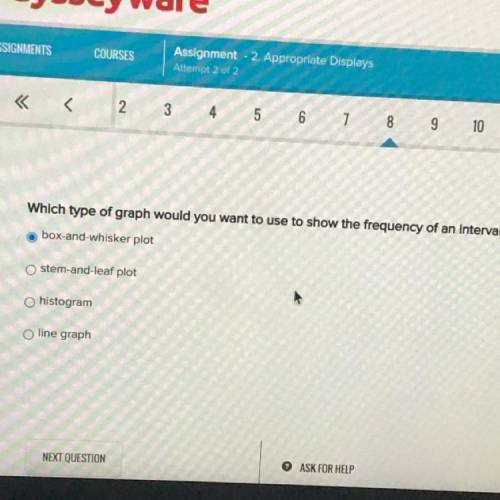
Which type of graph would you want to use to show the frequency of an interval?
box-and-whisker plot
stem-and-leaf plot
histogram
line graph


Answers: 3
Another question on Mathematics

Mathematics, 21.06.2019 15:20
Use the x-intercept method to find all real solutions of the equation. -9x^3-7x^2-96x+36=3x^3+x^2-3x+8
Answers: 1

Mathematics, 21.06.2019 16:10
20 da is equal to a. 2,000 cm. b. 2 m. c. 20,000 cm. d. 20,000 mm
Answers: 1

Mathematics, 21.06.2019 20:00
Someone answer asap for ! the boiling point of water at an elevation of 0 feet is 212 degrees fahrenheit (°f). for every 1,000 feet of increase in elevation, the boiling point of water decreases by about 2°f. which of the following represents this relationship if b is the boiling point of water at an elevation of e thousand feet? a. e = 2b - 212 b. b = 2e - 212 c. e = -2b + 212 d. b = -2e + 212
Answers: 1

Mathematics, 21.06.2019 20:10
A. use the formula for continuous compounding with the original example: $1000 invested at 2% for 1 year. record the amount to 5 decimal places. use a calculator. b. compare it to the result using the original compound interest formula with n = 365 calculated to 5 decimal places. which has a larger value? explain.
Answers: 1
You know the right answer?
Which type of graph would you want to use to show the frequency of an interval?
box-and-whisker plo...
Questions


Mathematics, 05.04.2021 07:20


History, 05.04.2021 07:20

Spanish, 05.04.2021 07:20

Chemistry, 05.04.2021 07:20

History, 05.04.2021 07:20


Mathematics, 05.04.2021 07:20


Chemistry, 05.04.2021 07:20

Mathematics, 05.04.2021 07:20

Chemistry, 05.04.2021 07:20


Mathematics, 05.04.2021 07:20


Biology, 05.04.2021 07:20


