
Mathematics, 09.06.2021 23:40 morgantisch25
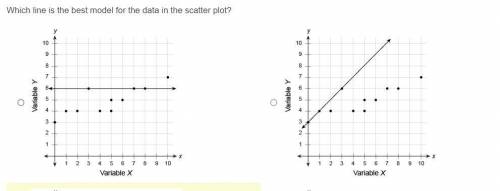
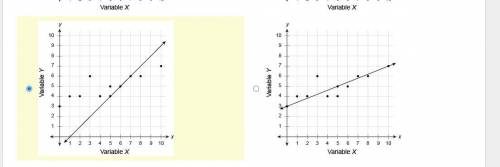
Which line is the best model for the data in the scatter plot?
Coordinate plane in the first quadrant. The x axis is labeled variable X and ranges from 0 to 10 in increments of 1. The y axis is labeled variable Y and ranges from 0 to 10 in increments of 1. The points on the graph are begin ordered pair 0 comma 3 end ordered pair, begin ordered pair 1 comma 4 end ordered pair, begin ordered pair 2 comma 4 end ordered pair, begin ordered pair 3 comma 6 end ordered pair, begin ordered pair 4 comma 4 end ordered pair, begin ordered pair 5 comma 4 end ordered pair, begin ordered pair 5 comma 5 end ordered pair, begin ordered pair 6 comma 5 end ordered pair, begin ordered pair 7 comma 6 end ordered pair, begin ordered pair 8 comma 6 end ordered pair, and begin ordered pair 10 comma 7 end ordered pair. A line is drawn through points begin ordered pair 3 comma 6 end ordered pair, begin ordered pair 7 comma 6 end ordered pair, and begin ordered pair 8 comma 6 end ordered pair.
Coordinate plane in the first quadrant. The x axis is labeled variable X and ranges from 0 to 10 in increments of 1. The y axis is labeled variable Y and ranges from 0 to 10 in increments of 1. The points on the graph are begin ordered pair 0 comma 3 end ordered pair, begin ordered pair 1 comma 4 end ordered pair, begin ordered pair 2 comma 4 end ordered pair, begin ordered pair 3 comma 6 end ordered pair, begin ordered pair 4 comma 4 end ordered pair, begin ordered pair 5 comma 4 end ordered pair, begin ordered pair 5 comma 5 end ordered pair, begin ordered pair 6 comma 5 end ordered pair, begin ordered pair 7 comma 6 end ordered pair, begin ordered pair 8 comma 6 end ordered pair, and begin ordered pair 10 comma 7 end ordered pair. A line is drawn through points begin ordered pair 0 comma 3 end ordered pair, begin ordered pair 1 comma 4 end ordered pair, and begin ordered pair 3 comma 6 end ordered pair.
Coordinate plane in the first quadrant. The x axis is labeled variable X and ranges from 0 to 10 in increments of 1. The y axis is labeled variable Y and ranges from 0 to 10 in increments of 1. The points on the graph are begin ordered pair 0 comma 3 end ordered pair, begin ordered pair 1 comma 4 end ordered pair, begin ordered pair 2 comma 4 end ordered pair, begin ordered pair 3 comma 6 end ordered pair, begin ordered pair 4 comma 4 end ordered pair, begin ordered pair 5 comma 4 end ordered pair, begin ordered pair 5 comma 5 end ordered pair, begin ordered pair 6 comma 5 end ordered pair, begin ordered pair 7 comma 6 end ordered pair, begin ordered pair 8 comma 6 end ordered pair, and begin ordered pair 10 comma 7 end ordered pair. A line is drawn through points begin ordered pair 5 comma 4 end ordered pair, begin ordered pair 6 comma 5 end ordered pair, and begin ordered pair 7 comma 6 end ordered pair.
Coordinate plane in the first quadrant. The x axis is labeled variable X and ranges from 0 to 10 in increments of 1. The y axis is labeled variable Y and ranges from 0 to 10 in increments of 1. The points on the graph are begin ordered pair 0 comma 3 end ordered pair, begin ordered pair 1 comma 4 end ordered pair, begin ordered pair 2 comma 4 end ordered pair, begin ordered pair 3 comma 6 end ordered pair, begin ordered pair 4 comma 4 end ordered pair, begin ordered pair 5 comma 4 end ordered pair, begin ordered pair 5 comma 5 end ordered pair, begin ordered pair 6 comma 5 end ordered pair, begin ordered pair 7 comma 6 end ordered pair, begin ordered pair 8 comma 6 end ordered pair, and begin ordered pair 10 comma 7 end ordered pair. A line is drawn through points begin ordered pair 0 comma 3 end ordered pair, begin ordered pair 5 comma 5 end ordered pair, and begin ordered pair 10 comma 7 end ordered pair.

Answers: 2
Another question on Mathematics
Mathematics, 21.06.2019 15:30
Aiden drives to school and back each day. the school is 16 miles from his home. he averages 40 miles per hour on his way to school. if his trip takes 1 hour, at approximately what speed does aiden drive home?
Answers: 1
Mathematics, 21.06.2019 17:30
Apublic library wants to place 4 magazines and 9 books on each display shelf. the expression 4s+9s represents the total number of items that will be displayed on s shelves. simplify the expression
Answers: 2
Mathematics, 21.06.2019 20:30
Find the magnitude, correct to two decimal places, made by each of the following with positive direction of the x axis a) y= x the answer is 45° but i don’t know how
Answers: 2
Mathematics, 22.06.2019 01:00
The stairs leading from the ground to the entrance of a plane forms a right triangle with the ground. if the distance of the stairs measures 22 feet and the ground distance measures 11 feet, how high is the entrance to the plane from the ground? which diagram represents this scenario? / 22ft © 22ft 11 ft 11 ft 22 it
Answers: 3
You know the right answer?
Which line is the best model for the data in the scatter plot?
Coordinate plane in the first quadra...
Questions

History, 24.09.2020 21:01
Mathematics, 24.09.2020 21:01
Mathematics, 24.09.2020 21:01

English, 24.09.2020 21:01
Mathematics, 24.09.2020 21:01
English, 24.09.2020 21:01


Chemistry, 24.09.2020 21:01
Mathematics, 24.09.2020 21:01
Mathematics, 24.09.2020 21:01
History, 24.09.2020 21:01
Mathematics, 24.09.2020 21:01
History, 24.09.2020 21:01
Mathematics, 24.09.2020 21:01


