
Mathematics, 11.06.2021 02:40 crebflower
The midterm grades for two high school algebra classes are provided in the tables below. For convenience, the data have been ordered.
Class 1: 72 73 74 75 76 79 82 83 84 86 91
92 93 93 94 95 97 97 98 98
Class 2: 59 65 68 69 72 73 78 80 82 82
83 83 85 88 88 89 94 96 97 98
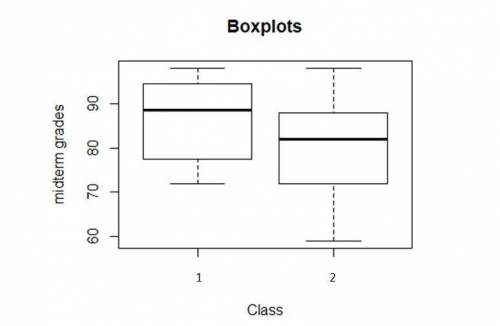
A. Sketch parallel boxplots for the two classes.
B. Which class has the better overall performance? Justify your answer.
C. The teacher for the two classes calculates a 90% confidence interval for the difference in mean midterm grades between Class #1 and Class #2. The confidence interval is (0.09299, 11.413). Assume that confidence interval conditions are met. Based on the confidence interval, do you think there is a difference in the population mean midterm grades for the two classes? Explain.

Answers: 1

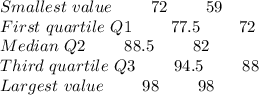
![\to five\ num(Class\ 1) \\\\\[1\] \ 72.0 77.5 88.5 94.5 98.0 \\\\\to five\ num(Class\ 2) \\\\\[1\]\ 59 72 82 88 98](/tpl/images/1370/9176/1347a.png)

 Please find the graph file.
![mean \ (Class \ 1) \\\\\[1\]\ 86.5\\\\mean\ (Class\ 2)\\\\](/tpl/images/1370/9176/e867d.png)
![\[ 1 \] \ 80.80952\\\\Difference = 86.5 - 80.80952 = 5.69048](/tpl/images/1370/9176/ba743.png)
Another question on Mathematics
Mathematics, 21.06.2019 14:10
Rachel reads 1/5 of the pages of a book plus 12 pages on the first day. on the second day, she reads 1/4 of the remaining pages plus 15 pages. on the third day, she reads 1/3 of the remaining pages plus 18 pages. on the fourth day, she reads the remaining 70 pages. how many total pages are in the book?
Answers: 2
Mathematics, 21.06.2019 14:10
What is the factored form of x2 − 4x − 5? (x + 5)(x − 1) (x + 5)(x + 1) (x − 5)(x − 1) (x − 5)(x + 1)
Answers: 2
Mathematics, 21.06.2019 19:30
Factor the following expression. 27y3 – 343 a. (3y + 7)(9y2 + 2ly + 49) b. (3y – 7)(9y2 + 2ly + 49) c. (3y – 7)(932 – 217 + 49) d. (3y + 7)(92 – 2ly + 49)
Answers: 1
You know the right answer?
The midterm grades for two high school algebra classes are provided in the tables below. For conveni...
Questions
Mathematics, 16.09.2019 03:10
Mathematics, 16.09.2019 03:10


English, 16.09.2019 03:10
Biology, 16.09.2019 03:10
English, 16.09.2019 03:10
English, 16.09.2019 03:10
English, 16.09.2019 03:10

Biology, 16.09.2019 03:10

History, 16.09.2019 03:10


Spanish, 16.09.2019 03:10


