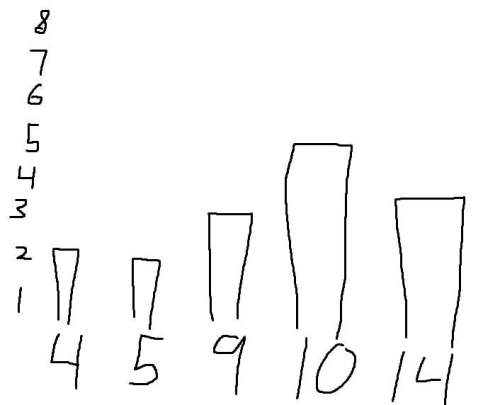

The diagram below shows the speed - time graph of the motion of an
athlete during a race.
Spee...

Mathematics, 11.06.2021 18:40 CassidgTab
The diagram below shows the speed - time graph of the motion of an
athlete during a race.
Speed
la ms
14
12
10
8
6
4
2
12
13
9 10
4
6
5
7 8
2
0 1
Time la seconds
(a) Using the graph determine,
(i) the MAXIMUM speed
(ii) the number of seconds for which the speed was constant
(iii) the TOTAL distance covered by the athlete during the race.
(b) During which time period of the race was,
(i) the speed of the athlete increasing
(ii) the speed of the athlete decreasing
(iii) the acceleration of the athlete zero?

Answers: 2
Another question on Mathematics
Mathematics, 21.06.2019 17:50
Graph y ≥ -x^2 - 1. click on the graph until the correct graph appears.
Answers: 1
Mathematics, 21.06.2019 18:30
What is coefficient of the term of degree of degree 5 in the polynomial below
Answers: 1
Mathematics, 21.06.2019 22:00
cassidy wants to cut the yellow fabric into strips that are 0.3 yards wide. how many strips of yellow fabric can cassidy make? yellow fabric 16 yards for $108.00.
Answers: 1
Mathematics, 22.06.2019 00:20
The police chief wants to know if the city’s african americans feel that the police are doing a good job. identify the management problem (i.e dependent variable) and identify the independent variable.
Answers: 1
You know the right answer?
Questions
Mathematics, 20.06.2019 18:02
Mathematics, 20.06.2019 18:02

Mathematics, 20.06.2019 18:02

Mathematics, 20.06.2019 18:02

Social Studies, 20.06.2019 18:02
English, 20.06.2019 18:02


History, 20.06.2019 18:02
English, 20.06.2019 18:02
Mathematics, 20.06.2019 18:02


