
Mathematics, 15.06.2021 19:00 thao5160
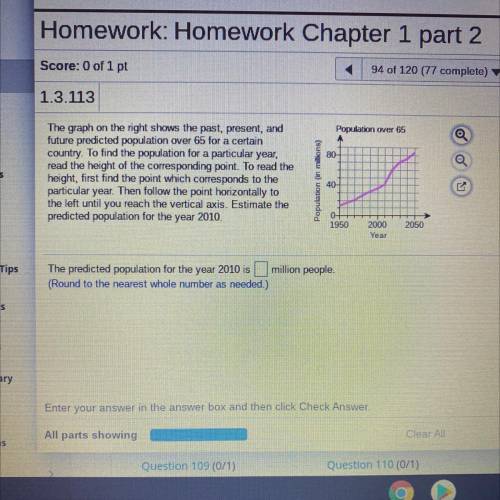
The graph on the right shows the past, present, and
future predicted population over 65 for a certain
country. To find the population for a particular year,
read the height of the corresponding point. To read the
height, first find the point which corresponds to the
particular year. Then follow the point horizontally to
the left until you reach the vertical axis. Estimate the
predicted population for the year 2020.

Answers: 3
Another question on Mathematics
Mathematics, 21.06.2019 18:30
Which of the statements about the graph of the function y = 2x are true? check all of the boxes that apply. the domain is all real numbers x because the exponent of 2 can be any real number when the x-values increases by 1 unit, the y-value multiplies by 2. the y-intercept is (0, 1). the graph never goes below the x-axis because powers of 2 are never negative. the range is all real numbers.
Answers: 1
Mathematics, 21.06.2019 19:00
Jack did 3/5 of all problems on his weekend homework before sunday. on sunday he solved 1/3 of what was left and the last 4 problems. how many problems were assigned for the weekend?
Answers: 3
Mathematics, 21.06.2019 19:30
Consider that lines b and c are parallel. what is the value of x? what is the measure of the smaller angle?
Answers: 1
You know the right answer?
The graph on the right shows the past, present, and
future predicted population over 65 for a certa...
Questions


Computers and Technology, 13.08.2021 01:00

Mathematics, 13.08.2021 01:00

Social Studies, 13.08.2021 01:00


