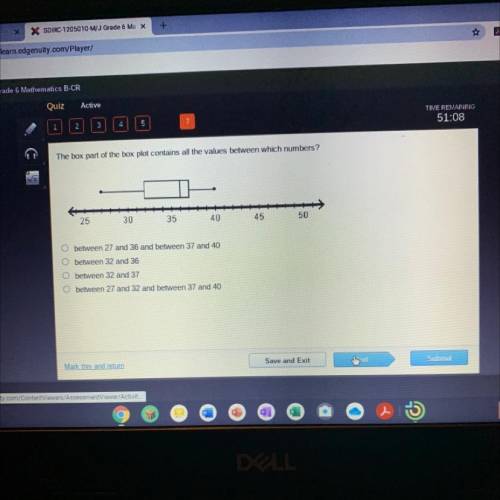
Between 32 and 37
Step-by-step explanation:
Here, we simply want to get the data portion represented by the box alone
we can see that the box starts from 32
It ends at the number 37
Note;
between each individual number on the plot, we have 5 small lines indicating an extra point