Mathematics, 22.06.2021 14:00 OfficallyRobloxedd
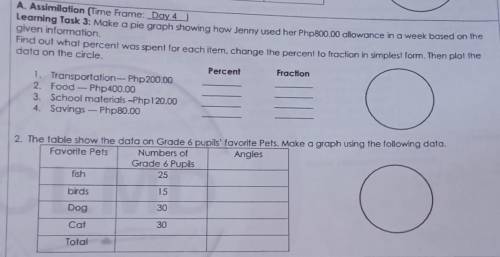
A. Assimilation (Time Frame: Day 4 )
Learning Task 3: Make a pie graph showing how Jenny used her Php800.00 allowance in a week based on the
given information.
Find out what percent was spent for each item, change the percent to fraction in simplest form. Then plot the
data on the circle.
Percent
Fraction
1. Transportation-- Php200.00
2. Food -- Php 400.00
3. School materials -Php120.00
4. Savings - Php 80.00
2. The table show the data on Grade 6 pupils' favorite Pets. Make a graph using the following data.
Favorite Pets
Angles
Numbers of
Grade 6 Pupils
25
fish
birds
15
Dog
30
Cat
30
Total


Answers: 1
Another question on Mathematics

Mathematics, 21.06.2019 18:30
Aswimming pool had 2.5 million liters of water in it. some water evaporated, and then the pool only had 22 million liters of water in it. what percent of the water evaporated?
Answers: 1

Mathematics, 21.06.2019 20:30
If a 36 inch yardstick casts a 21 foot shadow, how tall is a building whose shadow is 168 feet? what is the scale factor
Answers: 1

Mathematics, 22.06.2019 04:30
If a and b are real numbers, then |a-b| is always, sometimes or never equal to |b-a| ?
Answers: 1

Mathematics, 22.06.2019 06:50
Brainliest sealy's parents gave her $70 to spend at the briarridge fair .she spent $10 on flowers.if each antique flower vase at the fair costs$3 each,solve the inequality 10+3a≤70 to determine how many antique flower vases can sealy buy?
Answers: 1
You know the right answer?
A. Assimilation (Time Frame: Day 4 )
Learning Task 3: Make a pie graph showing how Jenny used her P...
Questions

Biology, 02.02.2020 17:05


Chemistry, 02.02.2020 17:05


Mathematics, 02.02.2020 17:05


Mathematics, 02.02.2020 17:05

Mathematics, 02.02.2020 17:05

Mathematics, 02.02.2020 17:05

Business, 02.02.2020 17:05

Geography, 02.02.2020 17:05


History, 02.02.2020 17:05


Mathematics, 02.02.2020 17:05

Mathematics, 02.02.2020 17:05


