
Mathematics, 30.06.2021 21:00 rehel1546
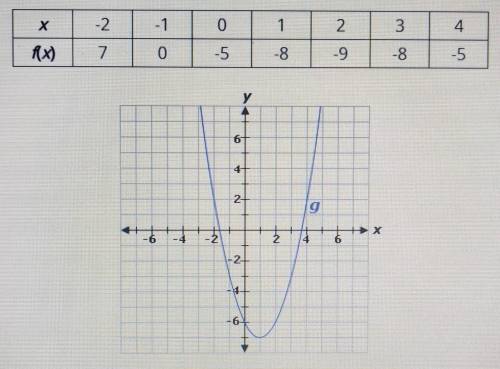
The table represents function f, and the graph represents function g.
x: -2, -1, 0, 1, 2, 3, 4
f(x): 7, 0, -5, -8, -9, -8, -5
The line of symmetry for function f is (y=9, x= -2, x=2, y= -9) and the line of symmetry for function g is (x=1,y=7,x= -1,y= -7). The y-intercept of function f is (equal to, less than, greater than) the y-intercept of function g. Over the interval [2, 4], the average rate of change of function f is (greater than, equal to, less than) the average rate of change of function g.

Answers: 2
Another question on Mathematics
Mathematics, 21.06.2019 20:30
Acompany produces packets of soap powder labeled “giant size 32 ounces.” the actual weight of soap powder in such a box has a normal distribution with a mean of 33 oz and a standard deviation of 0.7 oz. to avoid having dissatisfied customers, the company says a box of soap is considered underweight if it weighs less than 32 oz. to avoid losing money, it labels the top 5% (the heaviest 5%) overweight. how heavy does a box have to be for it to be labeled overweight?
Answers: 3
Mathematics, 21.06.2019 20:30
Cody was 165cm tall on the first day of school this year, which was 10% taller than he was on the first day of school last year.
Answers: 1
Mathematics, 21.06.2019 23:30
Astraight water slide is 175 feet above ground and is 200 feet long. what is the angle of depression to the bottom of the slide?
Answers: 1
You know the right answer?
The table represents function f, and the graph represents function g.
x: -2, -1, 0, 1, 2, 3, 4
Questions

Social Studies, 26.06.2019 18:40

Biology, 26.06.2019 18:40

English, 26.06.2019 18:40


Mathematics, 26.06.2019 18:40
English, 26.06.2019 18:40


History, 26.06.2019 18:40
History, 26.06.2019 18:40
Biology, 26.06.2019 18:40


