
Mathematics, 02.07.2021 23:40 villarrealc1987
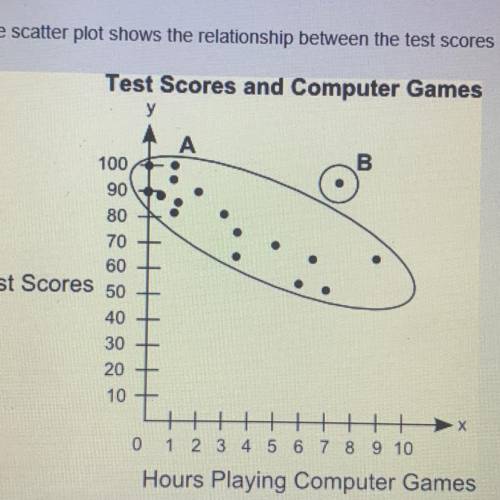
The scatterplot shows a relationship between the test scores of a group of students and the number of hours they play computer games in a week
Pate what is the group of points labeled A called? What is the point labeled B called? Give a possible reason for the presence of point B.
Part B: describe the association between students test scores and number of hours they play computer games

Answers: 2
Another question on Mathematics
Mathematics, 21.06.2019 20:30
Kyle and elijah are planning a road trip to california. their car travels 3/4 of a mile per min. if they did not stop driving, how many miles could kyle and elijah drove in a whole day? ? 1 day = 24 hours. plzzz write a proportion i will give you 100 points
Answers: 1
Mathematics, 21.06.2019 22:30
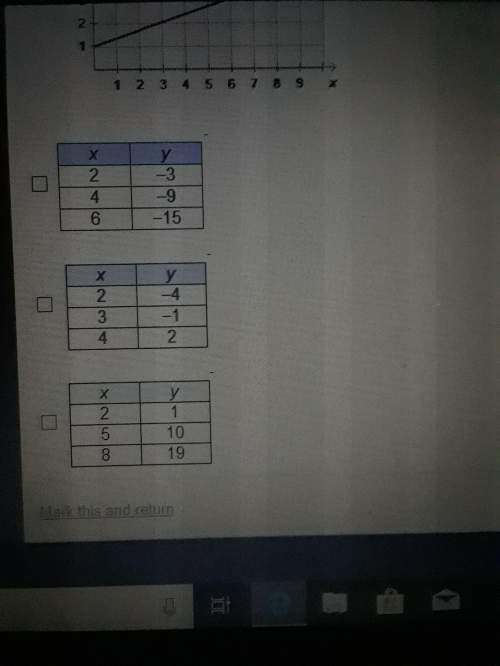
Which of the following graphs could represent a quartic function?
Answers: 1
Mathematics, 21.06.2019 23:30
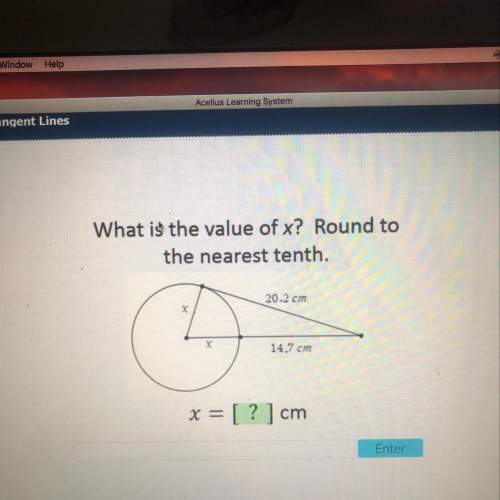
Answer each of the questions for the following diagram: 1. what type of angles are these? 2. solve for x. what does x equal? 3. what is the measure of the angles?
Answers: 1
Mathematics, 22.06.2019 00:10
A, at (-2, 4), is 6 .of a'? (-8, 4) (-8, -2) (-2, -2) (-2, 4) b, at (-4, -7), isy-.of b'? (-4, 7) (4, -7) (4, 7) (-4, -7)
Answers: 2
You know the right answer?
The scatterplot shows a relationship between the test scores of a group of students and the number o...
Questions

Physics, 25.08.2019 08:30
Mathematics, 25.08.2019 08:30


Mathematics, 25.08.2019 08:30

Mathematics, 25.08.2019 08:30
Mathematics, 25.08.2019 08:30
Mathematics, 25.08.2019 08:30

Chemistry, 25.08.2019 08:30
Mathematics, 25.08.2019 08:30
Biology, 25.08.2019 08:30

Health, 25.08.2019 08:30

Spanish, 25.08.2019 08:30

Social Studies, 25.08.2019 08:30


