
Mathematics, 10.07.2021 01:00 Jolenesopalski
Distributions and Comparing Data Project
Round all answers to the nearest tenth. Present your work in a neat, legible way. Show all work.
Given the data set (16 values):
8, 6, 10, 5, 7, 1, 6, 11, 5, 13, 14, 8, 11, 9, 8, 6
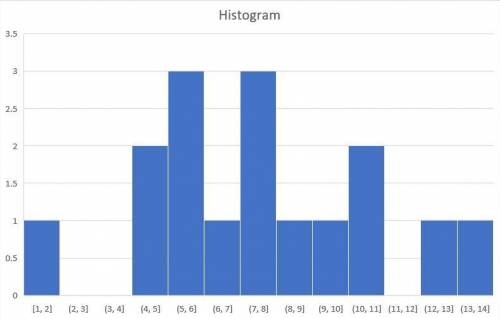
1. Create a histogram and a box plot to represent this data set. What is the shape of the data
representation? Explain your reasoning.
2. Which measure of center and spread would you use to represent this data? Explain your reasoning.
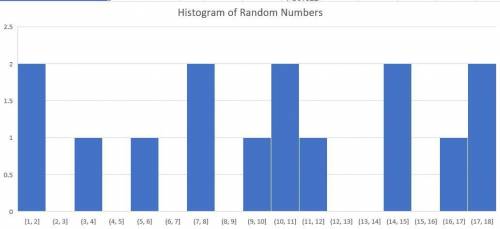
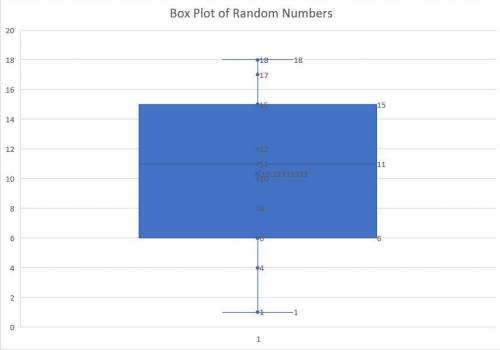
3. Use a random number generator to generate a set of 15 numbers between 1 and 20. Create a
histogram and box plot to represent your data set. Calculate measures of center and spread. Which
measure of center and spread would you use to represent your data?
For questions 6-9 refer to the box plots (Assume their positions are on same number line). Write your
Class A
Class B
Class C
Class D
o
4. Which class(es) appear to have the most consistent scores? Explain your reasoning,

Answers: 3
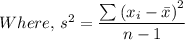
 = 453.333
 /(15 - 1) = 32.38
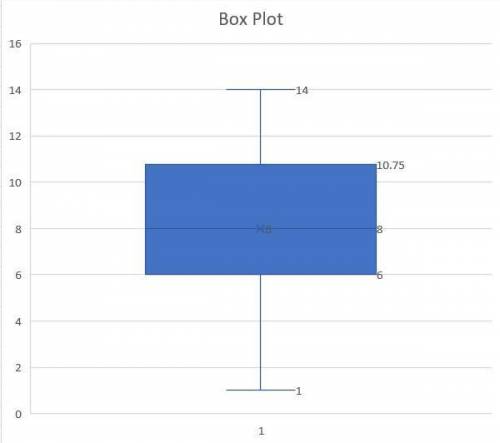
Another question on Mathematics
Mathematics, 21.06.2019 14:00
Plz need answer now will mark which situations represent linear functions? check all that apply. a)the temperature rises and falls over the course of a day. temperature is a function of time. b)a baseball is hit into the outfield. the height of the ball is a function of time. c)a car goes 55 mph on the highway. distance is a function of time. d)a child grew 2 inches this year and 1 inch last year. height is a function of time. e)a movie director makes 2 movies per year. the number of movies is a function of the years.
Answers: 3
Mathematics, 21.06.2019 15:30
Determine whether the set of whole numbers is closed under addition. explain why the set is or is not closed. give an example.
Answers: 1
Mathematics, 21.06.2019 16:30
Which of the following answers is 7/9 simplified? 7/9 2/9 11/9 2/7
Answers: 2
Mathematics, 21.06.2019 20:50
Amanda went into the grocery business starting with five stores. after one year, she opened two more stores. after two years, she opened two more stores than the previous year. if amanda expands her grocery business following the same pattern, which of the following graphs represents the number of stores she will own over time?
Answers: 3
You know the right answer?
Distributions and Comparing Data Project
Round all answers to the nearest tenth. Present your work...
Questions
Mathematics, 27.07.2019 19:50


History, 27.07.2019 19:50
Mathematics, 27.07.2019 19:50
Mathematics, 27.07.2019 19:50

Chemistry, 27.07.2019 19:50
History, 27.07.2019 19:50


Social Studies, 27.07.2019 19:50
Chemistry, 27.07.2019 19:50


