
Mathematics, 13.07.2021 06:20 joshuaburge13
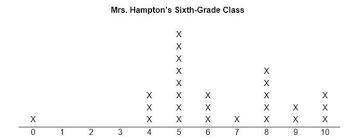
A survey was conducted to determine how many movies were seen in one month among the students
in Mrs. Hampton’s sixth-grade class. The results are shown in the dot plot below.
Step 1: Calculate the measures of center for Mrs. Hampton's data in the dot plot (round your
answer to the nearest tenths place). Show your work and briefly explain each step. (Measures of
Center are the Mean and Median of a data set)
Step 2: Calculate the measures of SPREAD for rs. Hampton's data in the dot plot. Show your work
and briefly explain each step. Measures of Spread are Range, IQR (Inter-Quartile Range) and
Mean Absolute Deviation.
Step 3: Collect and Record Your own data! Ask exactly 25 people the same question as above
(How many movies did you see in the last month). Record your data and Create a dot plot showing
your results.
Step 4: Calculate the measures of center for your data set (mean and median). Show your work!
Step 5: Calculate the measures of spread for your data set (Range, IQR and MAD). Show your
work!
Step 6: Create a BOX PLOT comparison for the two sets of data. Be sure to label each box plot
(Mrs. Hampton's Class, My Data)
Step 7: Summary-Compare the two data sets. Discuss similarities and differences in the two sets
of data (think about striking deviations, gaps, peaks, clusters, etc.). In your summary, answer the
following questions.
-What conclusion can you draw from looking at each data set?
-What does the measures of center and measures of spread tell you about each data set?
-Is either data set skewed? How do you know?
-Is it possible to use either or both of these data sets to draw VALID conclusions about the
number of movies a person sees in one month? Why or why not?
-Can you draw the same conclusion from the two different sets of data? Why or why not?
-Which set of data is more "spread" out based on your visual and your calculations.
-Which is a better measure of spread, the Range or the IQR and Why?

Answers: 3
Another question on Mathematics
Mathematics, 21.06.2019 13:40
On any given day, the number of users, u, that access a certain website can be represented by the inequality 1125-4530 which of the following represents the range of users that access the website each day? u> 95 or u < 155 95> u> 155 u< 95 or > 155 95
Answers: 2
Mathematics, 21.06.2019 18:30
Astuntman jumping off a 20-m-high building is modeled by the equation h=20-5t^2, where t is the same in seconds. a high-speed camera is ready to film him between 15m and 10m above the ground. for which interval of time should the camera film him?
Answers: 1
Mathematics, 22.06.2019 01:10
If the probability of an event happening is 65% then the probability this event does not occur?
Answers: 1
Mathematics, 22.06.2019 01:40
Amass weighing 16 pounds stretches a spring 8/3 feet. the mass is initially released from rest from a point 2 feet below the equilibrium position, and the subsequent motion takes place in a medium that offers a damping force that is numerically equal to 1/2 the instantaneous velocity. find the equation of motion if the mass is driven by an external force equal to f(t)=cos(2t).
Answers: 2
You know the right answer?
A survey was conducted to determine how many movies were seen in one month among the students
in Mr...
Questions
Mathematics, 24.11.2020 18:50

English, 24.11.2020 18:50

Mathematics, 24.11.2020 18:50

English, 24.11.2020 18:50

Mathematics, 24.11.2020 18:50

Physics, 24.11.2020 18:50
English, 24.11.2020 18:50
English, 24.11.2020 18:50


