Question 1 (Essay Worth 10 points)
(05.01 MC)
The graph shows the prices of different n...

Mathematics, 20.07.2021 07:50 reinasuarez964
Question 1 (Essay Worth 10 points)
(05.01 MC)
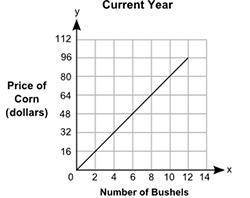
The graph shows the prices of different numbers of bushels of corn at a store in the current year. The table shows the prices of different numbers of bushels of corn at the same store in the previous year.
A graph shows Number of Bushels on x-axis and Price of Corn in dollars on y-axis. The x-axis scale is shown from 0 to 14 at increments of 2, and the y-axis scale is shown from 0 to 112 at increments of 16. A straight line joins the ordered pairs 2, 16 and 4, 32 and 6, 48 and 8, 64 and 10, 80 and 12, 96.
Previous Year
Number of Bushels
Price of Corn (dollars)
2
12
4
24
6
36
8
48
Part A: Describe in words how you can find the rate of change of a bushel of corn in the current year, and find the value. (5 points)
Part B: How many dollars more is the price of a bushel of corn in the current year than the price of a bushel of corn in the previous year? Show your work. (5 points)

Answers: 1
Another question on Mathematics
Mathematics, 21.06.2019 21:00
Which expression is equal to (21)(7)(3x) using the associative property? (21 · 7 · 3)x (7)(21)(3x) 32(7 + 3x) (3x)(7)(21)
Answers: 2
Mathematics, 21.06.2019 21:40
The number of chocolate chips in a bag of chocolate chip cookies is approximately normally distributed with a mean of 12611261 chips and a standard deviation of 118118 chips. (a) determine the 2626th percentile for the number of chocolate chips in a bag. (b) determine the number of chocolate chips in a bag that make up the middle 9696% of bags. (c) what is the interquartile range of the number of chocolate chips in a bag of chocolate chip cookies?
Answers: 2
Mathematics, 21.06.2019 22:40
Adeli owner keeps track of the to-go orders each day. the results from last saturday are shown in the given two-way frequency table. saturday's to-go deli orders in person by phone online total pick up 38 25 31 94 delivery 35 28 34 97 total 73 53 65 191 what percent of the to-go orders were delivery orders placed by phone? a. 14.66% b. 38.41% c. 28.87% d. 52.83%
Answers: 2
You know the right answer?
Questions

Mathematics, 24.11.2020 05:50

English, 24.11.2020 05:50
Mathematics, 24.11.2020 05:50
Mathematics, 24.11.2020 05:50
Mathematics, 24.11.2020 05:50

History, 24.11.2020 05:50

Social Studies, 24.11.2020 05:50

English, 24.11.2020 05:50
History, 24.11.2020 05:50

Mathematics, 24.11.2020 05:50
Mathematics, 24.11.2020 05:50

Chemistry, 24.11.2020 05:50


