
Mathematics, 21.07.2021 19:00 heids17043
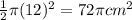
The fan below has been stretched open as far as it will go to form a semi-circle.
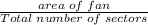
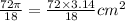
Each of the eighteen sectors formed by the fan consists of the same amount of fabric. The length of
each wooden rod that connects the center of the fan to its edge is 12 cm. The wooden rods are
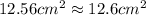
glued to the fabric forming the fan. Determine the approximate area of each sector.

Answers: 1


Another question on Mathematics
Mathematics, 21.06.2019 14:40
Write the sentence as an equation. 6 fewer than the quantity 140 times j equals 104
Answers: 2
Mathematics, 21.06.2019 16:00
Part one: measurements 1. measure your own height and arm span (from finger-tip to finger-tip) in inches. you will likely need some from a parent, guardian, or sibling to get accurate measurements. record your measurements on the "data record" document. use the "data record" to you complete part two of this project. name relationship to student x height in inches y arm span in inches archie dad 72 72 ginelle mom 65 66 sarah sister 64 65 meleah sister 66 3/4 67 rachel sister 53 1/2 53 emily auntie 66 1/2 66 hannah myself 66 1/2 69 part two: representation of data with plots 1. using graphing software of your choice, create a scatter plot of your data. predict the line of best fit, and sketch it on your graph. part three: the line of best fit include your scatter plot and the answers to the following questions in your word processing document 1. 1. which variable did you plot on the x-axis, and which variable did you plot on the y-axis? explain why you assigned the variables in that way. 2. write the equation of the line of best fit using the slope-intercept formula $y = mx + b$. show all your work, including the points used to determine the slope and how the equation was determined. 3. what does the slope of the line represent within the context of your graph? what does the y-intercept represent? 5. use the line of best fit to you to describe the data correlation.
Answers: 2
Mathematics, 21.06.2019 19:30
Aproduction manager test 10 toothbrushes and finds that their mean lifetime is 450 hours. she then design sales package of this type of toothbrush. it states that the customers can expect the toothbrush to last approximately 460 hours. this is an example of what phase of inferential statistics
Answers: 1
You know the right answer?
The fan below has been stretched open as far as it will go to form a semi-circle.
Each of the eight...
Questions

Chemistry, 28.06.2021 09:10


Mathematics, 28.06.2021 09:10

History, 28.06.2021 09:10
Mathematics, 28.06.2021 09:10
History, 28.06.2021 09:10
Chemistry, 28.06.2021 09:10

Physics, 28.06.2021 09:10

Computers and Technology, 28.06.2021 09:10
Computers and Technology, 28.06.2021 09:10
Mathematics, 28.06.2021 09:10

Biology, 28.06.2021 09:10
English, 28.06.2021 09:10
Mathematics, 28.06.2021 09:10
Mathematics, 28.06.2021 09:10


