
Mathematics, 21.07.2021 20:50 payshencec21
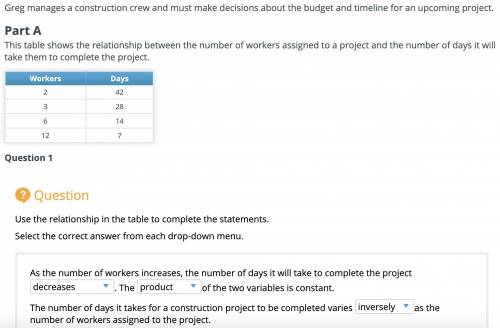
This table shows the relationship between the number of workers assigned to a project and the number of days it will take them to complete the project.
Workers Days
2 42
3 28
6 14
12 7
Use the relationship in the table to complete the statements.
Select the correct answer from each drop-down menu.
As the number of workers increases, the number of days it will take to complete the project _. The _ of the two variables is constant.
The number of days it takes for a construction project to be completed varies _ as the number of workers assigned to the project.

Answers: 2
Another question on Mathematics
Mathematics, 21.06.2019 20:30
What is the interquartile range of this data set? 2, 5, 9, 11, 18, 30, 42, 48, 55, 73, 81
Answers: 1
Mathematics, 22.06.2019 01:00
Pleasse me i need an answer. give me the correct answer. answer if you know it ! the club will base its decision about whether to increase the budget for the indoor rock climbing facility on the analysis of its usage. the decision to increase the budget will depend on whether members are using the indoor facility at least two times a week. use the best measure of center for both data sets to determine whether the club should increase the budget. assume there are four weeks in a month. if you think the data is inconclusive, explain why.
Answers: 3
Mathematics, 22.06.2019 01:20
Given: δabc, m∠1=m∠2, d∈ ac bd = dc m∠bdc = 100º find: m∠a m∠b, m∠c
Answers: 2
Mathematics, 22.06.2019 01:30
The angle of elevation from point a to the top of a cliff is 38 degrees . if point a is 80 feet from the base of the cliff , how high is the cliff ?
Answers: 3
You know the right answer?
This table shows the relationship between the number of workers assigned to a project and the number...
Questions
Mathematics, 23.07.2019 23:10

Advanced Placement (AP), 23.07.2019 23:10
Mathematics, 23.07.2019 23:10


Social Studies, 23.07.2019 23:10


Social Studies, 23.07.2019 23:10
Social Studies, 23.07.2019 23:10
Social Studies, 23.07.2019 23:10


