Mathematics, 23.07.2021 03:50 tingzontumbler8412
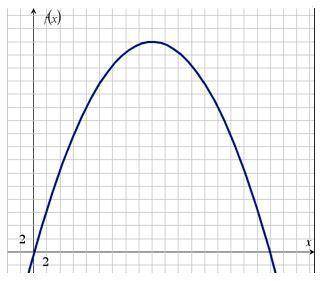
The graph below shows the height of a tunnel f(x), in feet, depending on the distance from one side of the tunnel x, in feet:
Graph of quadratic function f of x having x intercepts at ordered pairs 0, 0 and 36, 0. The vertex is at 18, 32.
Part A: What do the x-intercepts and maximum value of the graph represent? What are the intervals where the function is increasing and decreasing, and what do they represent about the distance and height? (6 points)
Part B: What is an approximate average rate of change of the graph from x = 5 to x = 15, and what does this rate represent? (4 points)


Answers: 3
Another question on Mathematics


Mathematics, 21.06.2019 15:50
Create and solve a linear equation that represents the model, where squares and triangles are shown evenly balanced on a balance beam. assume the weight of a square is 1 unit and the weight of a triangle is unknown.
Answers: 3

Mathematics, 21.06.2019 19:30
Kyle and elijah are planning a road trip to california. their car travels 3/4 of a mile per min if they did not stop driving, how many miles could kyle and elijah drive in a whole day? ? 1 day = 24 hours. plzzz i will give you 100 points
Answers: 2

Mathematics, 21.06.2019 20:00
Which type of graph would allow us to quickly see how many students between 100 and 200 students were treated?
Answers: 1
You know the right answer?
The graph below shows the height of a tunnel f(x), in feet, depending on the distance from one side...
Questions

History, 08.01.2021 07:30

Mathematics, 08.01.2021 07:30

History, 08.01.2021 07:30


Mathematics, 08.01.2021 07:30


Mathematics, 08.01.2021 07:30

History, 08.01.2021 07:30

English, 08.01.2021 07:30


Health, 08.01.2021 07:40


Social Studies, 08.01.2021 07:40


Arts, 08.01.2021 07:40


