
Mathematics, 25.07.2021 06:30 whitakers87
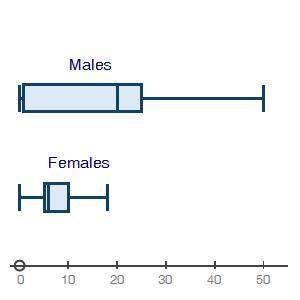
Male and female high school students reported how many hours they worked each week in summer jobs. The data is represented in the following box plots:
two box plots shown. The top one is labeled Males. Minimum at 0, Q1 at 1, median at 20, Q3 at 25, maximum at 50. The bottom box plot is labeled Females. Minimum at 0, Q1 at 5, median at 6, Q3 at 10, maximum at 18
Identify any values of data that might affect the statistical measures of spread and center.
The females worked less than the males, and the female median is close to Q1.
There is a high data value that causes the data set to be asymmetrical for the males.
There are significant outliers at the high ends of both the males and the females.
Both graphs have the required quartiles.

Answers: 1
Another question on Mathematics
Mathematics, 21.06.2019 15:20
Which function is increasing? o a. f(x)=(1/15)* o b. f(x)= (0.5)* o c. f(x)=(1/5)* o d. f(x) = 5*
Answers: 1
Mathematics, 21.06.2019 18:00
The longer leg of a 30° 60° 90° triangle is 16 times square root of three how long is a shorter leg
Answers: 1
Mathematics, 21.06.2019 22:00
Find the value of x in each case. give reasons to justify your solutions! d q ∈ pr
Answers: 3
Mathematics, 21.06.2019 23:20
Which equation can be solved to find x the measure of jk in the apex
Answers: 3
You know the right answer?
Male and female high school students reported how many hours they worked each week in summer jobs. T...
Questions

Mathematics, 26.02.2020 02:08
Mathematics, 26.02.2020 02:08
Mathematics, 26.02.2020 02:08
Mathematics, 26.02.2020 02:08

History, 26.02.2020 02:08


History, 26.02.2020 02:08

Mathematics, 26.02.2020 02:08


