
Mathematics, 26.07.2021 02:40 kelsiee24
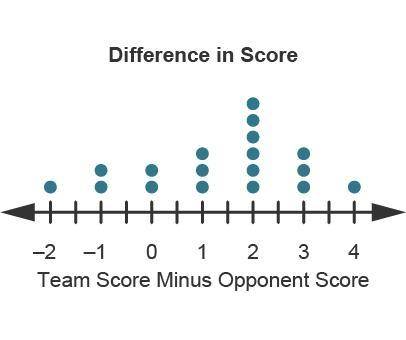
The dotplot below displays the difference in scores for 18 games between a high school soccer team and its opponent.
A dotplot titled difference in Score. A number line going from negative 2 to 4 is labeled Team score minus opponent score. Negative 2, 1; negative 1, 2; 0, 2; 1, 3; 2, 6; 3, 3; 4, 1.
Which of the following is the best explanation for the dots at –1?
In one game, the team beat the opponent by 1 goal.
In two games, the team beat the opponent by 1 goal.
In one game, the team lost to the opponent by 1 goal.
In two games, the team lost to the opponent by 1 goal.

Answers: 3
Another question on Mathematics
Mathematics, 21.06.2019 17:30
The marriott family bought a new apartment three years ago for $65,000. the apartment is now worth $86,515. assuming a steady rate of growth, what was the yearly rate of appreciation? what is the percent of the yearly rate of appreciation?
Answers: 1
Mathematics, 21.06.2019 19:00
The distributive property allows you to say that 3(x − 1) = 3x −
Answers: 1
Mathematics, 21.06.2019 19:30
Solve the following simultaneous equation by using an algebraic method (either substitution or elimination) 2x + 3y=-4 4x-y=11
Answers: 1
Mathematics, 21.06.2019 20:00
Ialready asked this but i never got an answer. will give a high rating and perhaps brainliest. choose the linear inequality that describes the graph. the gray area represents the shaded region. y ≤ –4x – 2 y > –4x – 2 y ≥ –4x – 2 y < 4x – 2
Answers: 1
You know the right answer?
The dotplot below displays the difference in scores for 18 games between a high school soccer team a...
Questions

English, 16.04.2021 20:50
Mathematics, 16.04.2021 20:50

Geography, 16.04.2021 20:50
Mathematics, 16.04.2021 20:50
Mathematics, 16.04.2021 20:50
Mathematics, 16.04.2021 20:50
Geography, 16.04.2021 20:50
Mathematics, 16.04.2021 20:50
Mathematics, 16.04.2021 20:50
Mathematics, 16.04.2021 20:50
Mathematics, 16.04.2021 20:50


Spanish, 16.04.2021 20:50
Mathematics, 16.04.2021 20:50


