A box plot is shown
O
2
4
6
8
10
12
Determine the five-st...

Mathematics, 27.07.2021 19:40 yrodrig13
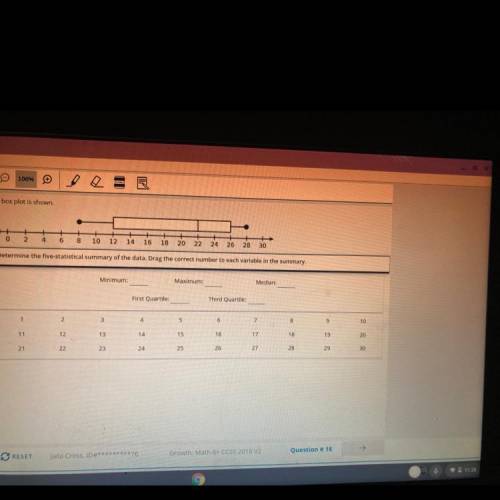
A box plot is shown
O
2
4
6
8
10
12
Determine the five-statistical summary of the data. Drag the correct number to each variable in the summary.
14
16
18
20
22 24 26
28
30
Minimum:
Maximum:
Median:
First Quartile:
Third Quartile:
1
2
3
4
11
5
12
6
ما تا ته
13
14
8
21
15
22
16
10
23
17
24
18
25
19
26
20
27
28
29
30
Please answer fast

Answers: 2
Another question on Mathematics
Mathematics, 21.06.2019 16:00
Apatient is to take 60 mg of an antibiotic on day 1, take 45mg on days 2 and 3, take 30mg on days 4 and 5 and take 15 mg on days 6 and 7. how many total mg will the patient take?
Answers: 1
Mathematics, 22.06.2019 04:30
What is the hypotenuse of a triangle with 4 ft and 5 ft
Answers: 1
You know the right answer?
Questions


Chemistry, 23.07.2019 15:30
English, 23.07.2019 15:30

Mathematics, 23.07.2019 15:30
Biology, 23.07.2019 15:30
Mathematics, 23.07.2019 15:30

Spanish, 23.07.2019 15:30


