
Mathematics, 28.07.2021 05:10 Alexishp33
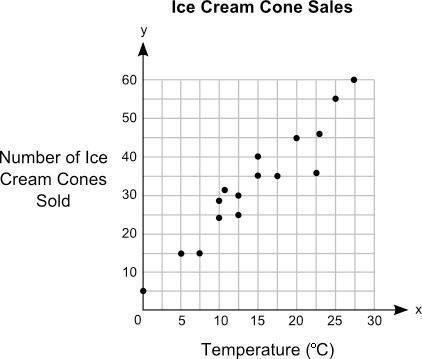
The scatter plot below shows the relationship between years of education and income for a representative sample of adults.
Which of the following is the best estimate of the average change in a person's income that is associated with going to school for an additional year?
Choose 1
Choose 1
(Choice A)
A
$
1
$1dollar sign, 1
(Choice B)
B
$
2
$2dollar sign, 2
(Choice C)
C
$
3000
$3000dollar sign, 3000
(Choice D)
D
$
7000
$7000dollar sign, 7000
2
2
4
4
6
6
8
8
10
10
12
12
14
14
16
16
18
18
20
20
22
22
24
24
20000
20000
40000
40000
60000
60000
80000
80000Annual income (dollars)Years of education

Answers: 2
Another question on Mathematics
Mathematics, 21.06.2019 19:40
An alternative to car buying is to make monthly payments for a period of time, and then return the vehicle to the dealer, or purchase it. this is called
Answers: 3
Mathematics, 21.06.2019 20:00
The table shows the age and finish time of ten runners in a half marathon. identify the outlier in this data set. drag into the table the ordered pair of the outlier and a reason why that point is an outlier.
Answers: 1
Mathematics, 21.06.2019 21:00
When solving this problem: 3025/5.5 = a/90.75 you get 49912.5 which would be the length of one of the sides of a square when the area is only 90.75 inches. is that answer correct, why, and how is it possible?
Answers: 1
You know the right answer?
The scatter plot below shows the relationship between years of education and income for a representa...
Questions


History, 24.02.2020 18:29


Chemistry, 24.02.2020 18:29

Health, 24.02.2020 18:30
History, 24.02.2020 18:30

Biology, 24.02.2020 18:30


