What is the interquartile range (IQR) of the data set represented by this box
plot?
2
1...

Mathematics, 13.08.2021 05:50 rigobertogarza2
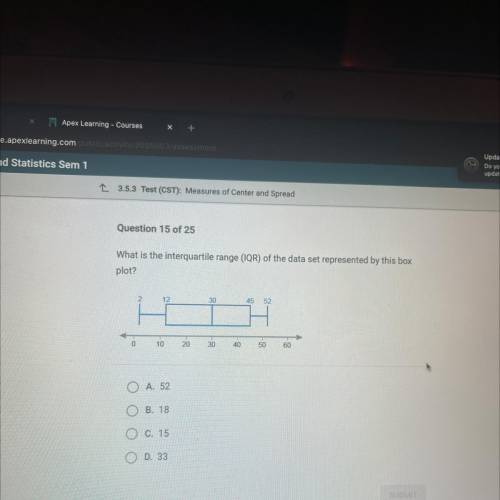
What is the interquartile range (IQR) of the data set represented by this box
plot?
2
12
30
45
52
0
0
10
20
30
40
50
60
O
A. 52
B. 18
O C. 15
O D. 33
SUBMIT

Answers: 3
Another question on Mathematics
Mathematics, 21.06.2019 17:00
The table shows population statistics for the ages of best actor and best supporting actor winners at an awards ceremony. the distributions of the ages are approximately bell-shaped. compare the z-scores for the actors in the following situation. best actor best supporting actor muequals42.0 muequals49.0 sigmaequals7.3 sigmaequals15 in a particular year, the best actor was 59 years old and the best supporting actor was 45 years old. determine the z-scores for each. best actor: z equals best supporting actor: z equals (round to two decimal places as needed.) interpret the z-scores. the best actor was (more than 2 standard deviations above more than 1 standard deviation above less than 1 standard deviation above less than 2 standard deviations below) the mean, which (is not, is) unusual. the best supporting actor was (less than 1 standard deviation below more than 1 standard deviation above more than 2 standard deviations below more than 1 standard deviation below) the mean, which (is is not) unusual.
Answers: 1
Mathematics, 21.06.2019 18:40
Some boys and girls were asked if they had a pet. one third of the group were boys. there were 20 boys. 20% of the girls had a pet. boys with a pet : girls with a pet = 1 : 5 i need to know how many girls there are.
Answers: 3
Mathematics, 21.06.2019 23:00
An elevator travels 310 feet in 10 seconds. at that speed, how far can't his elevator travel in 12 seconds?
Answers: 1
You know the right answer?
Questions


Social Studies, 22.06.2019 01:00

History, 22.06.2019 01:00

Mathematics, 22.06.2019 01:00

Mathematics, 22.06.2019 01:00
English, 22.06.2019 01:00
Mathematics, 22.06.2019 01:00


