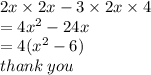
Simplify:-
(2x) ×(2x)-3×(2x)4...

Answers: 2
Another question on Mathematics

Mathematics, 21.06.2019 23:00
The equation shown below represents function f. f(x)= -2x+5 the graph shown below represents function g. which of the following statements is true? a. over the interval [2, 4], the average rate of change of f is the same as the average rate of change of g. the y-intercept of function f is less than the y-intercept of function g. b. over the interval [2, 4], the average rate of change of f is greater than the average rate of change of g. the y-intercept of function f is greater than the y-intercept of function g. c. over the interval [2, 4], the average rate of change of f is the same as the average rate of change of g. the y-intercept of function f is greater than the y-intercept of function g. d. over the interval [2, 4], the average rate of change of f is less than the average rate of change of g. the y-intercept of function f is the same as the y-intercept of function g.
Answers: 1
Mathematics, 22.06.2019 02:00
Choose the right classification of 5x + 3x^4 - 7x^3 + 10 by number terms and he degree 1. third degree polynomial 2. fourth degree polynomial 3. sixth degree polynomial 4. first degree binomial
Answers: 1
Mathematics, 22.06.2019 02:20
Two researchers are attempting to create a new psychotherapy protocol that more reduces panic attacks. they believe that they have succeeded and are now in the clinical trial period of their protocol's development. they are working with several cohort groups, some of which have been through the new protocol, while others have done the standard protocol currently recommended. if these researchers are interested in evaluating the difference in the percentage of test subjects who successfully decreased their panic attacks in 2 months on the new protocol versus the percentage of test subjects who successfully decreased their panic attacks in 2 months with the traditional protocol, which of the following statistical tests would be most appropriate? a. analysis of variance (anova) b. correlation c. chi-square test d. paired t-test e. independent t-test
Answers: 2
Mathematics, 22.06.2019 04:00
The given dot plot represents the average daily temperatures, in degrees fahrenheit, recorded in a town during the first 15 days of september. if the dot plot is converted to a box plot, the first quartile would be drawn at , ( 59,60,61,62) and the third quartile would be drawn at . (61,62,63,64)
Answers: 2
You know the right answer?
Questions
Mathematics, 11.11.2020 02:40
Mathematics, 11.11.2020 02:50


Advanced Placement (AP), 11.11.2020 02:50

Social Studies, 11.11.2020 02:50
Mathematics, 11.11.2020 02:50

Arts, 11.11.2020 02:50
Mathematics, 11.11.2020 02:50

Mathematics, 11.11.2020 02:50
Mathematics, 11.11.2020 02:50

English, 11.11.2020 02:50
Mathematics, 11.11.2020 02:50

Mathematics, 11.11.2020 02:50


