x y

Mathematics, 25.08.2021 04:20 sodiumvlogsYT
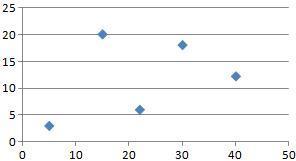
The following 20 observations are for two quantitative variables, x and y.
Observation
x y
1 -22 22
2 -33 49
3 2 8
4 29 -16
5 -13 10
6 21 -28
7 -13 27
8 -23 35
9 14 -5
10 3 -3
11 -37 48
12 34 -29
13 9 -18
14 -33 31
15 20 -16
16 -3 14
17 -15 18
18 12 17
19 -20 -11
20 -7 -22
(a) Create a scatter chart in Excel for these 20 observations.
(b) Fit a linear trendline to the 20 observations. What can you say about the relationship between these two quantitative variables? Choose the correct answer below.
(i) The trendline confirms that there is a positive linear trend between profits and market capitalization.
(ii) The trendline confirms that there is a negative linear trend between profits and market capitalization.

Answers: 3
Another question on Mathematics
Mathematics, 21.06.2019 15:10
12x + 1 = 25 solve the following equation. then place the correct number in the box provided.
Answers: 2
Mathematics, 21.06.2019 18:30
Idon’t understand! use slope intercept form to solve: through: (2,5) slope= undefined
Answers: 1
Mathematics, 22.06.2019 01:00
If johnny ate 5 cans of sugar, but in the kitchen they only had 3. what did johnny eat? (he found a secret stash btw.)
Answers: 2
Mathematics, 22.06.2019 01:20
Given: δabc, m∠1=m∠2, d∈ ac bd = dc m∠bdc = 100º find: m∠a m∠b, m∠c
Answers: 2
You know the right answer?
The following 20 observations are for two quantitative variables, x and y.
Observation
x y
x y
Questions


Computers and Technology, 03.04.2020 21:59


English, 03.04.2020 21:59

Social Studies, 03.04.2020 21:59


