Mathematics, 07.09.2021 21:40 judt3500
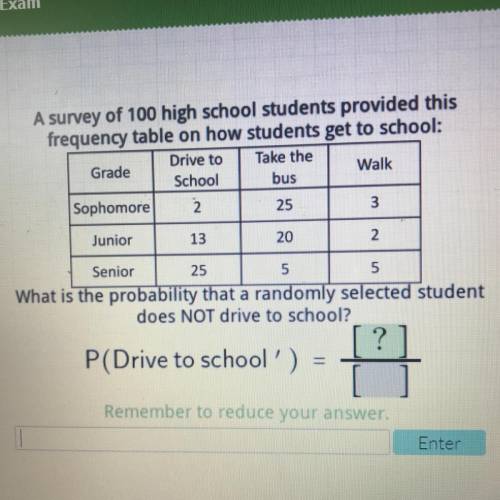
A survey of 100 high school students provided this
frequency table on how students get to school:
Drive to Take the
Grade
Walk
School bus
Sophomore 2
25
3
Junior
13
20
2
5
5
Senior 25
What is the probability that a randomly selected student
does NOT drive to school?
P(Drive to school?) =
Remember to reduce your answer.


Answers: 3
Another question on Mathematics

Mathematics, 21.06.2019 22:40
The value of x in this system of equations is 1. 3x + y = 9 y = –4x + 10 substitute the value of y in the first equation: combine like terms: apply the subtraction property of equality: apply the division property of equality: 3x + (–4x + 10) = 9 –x + 10 = 9 –x = –1 x = 1 what is the value of y?
Answers: 1

Mathematics, 21.06.2019 23:00
Given the expression (7 ? 4i) ? (2 + 6i), perform the indicated operation and write the answer in the form a + bi.
Answers: 1

Mathematics, 21.06.2019 23:00
Bobs burgers bam has a special deal of 4 hamburgers for $6. at that rate, how much should it cost to buy 3 hamburgers?
Answers: 1

Mathematics, 21.06.2019 23:10
Consider the following function. which of the following graphs corresponds to the given function? w. x. y. z. a. z b. y c. x d.
Answers: 1
You know the right answer?
A survey of 100 high school students provided this
frequency table on how students get to school:<...
Questions


Mathematics, 22.09.2020 14:01

Biology, 22.09.2020 14:01


Mathematics, 22.09.2020 14:01


Social Studies, 22.09.2020 14:01


Mathematics, 22.09.2020 14:01

Mathematics, 22.09.2020 14:01

Mathematics, 22.09.2020 14:01


Mathematics, 22.09.2020 14:01


