Answer: 10pi
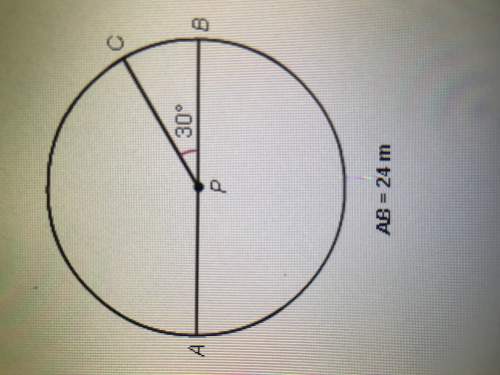
x = central angle apc = measure of minor arc ac
the two angles x and 30 add to 180, so x+30 = 180 and x = 180-30 = 150. the measure of minor arc ac is 150 degrees.
what we need to do from here is find the circumference and then multiply it by x/360 since there are 360 degrees in a circle. in this case, x = 150, so x/360 = 150/360 = 15/36 = 5/12. the shortest distance along the curve from a to c is 5/12 of the distance around the entire circle (aka circumference)
c = circumference
c = pi*d
c = pi*24
c = 24pi
now multiply this by 5/12 to get
distance along minor arc ac = (5/12)*(circumference)
distance along minor arc ac = (5/12)*(24pi)
distance along minor arc ac = 10pi
the formula you can use is
l = (x/360)*pi*d
with
l = length of minor arc
x = central angle
d = diameter
which essentially is the steps we took though a bit differently.