
Mathematics, 15.09.2021 19:40 Retzzi
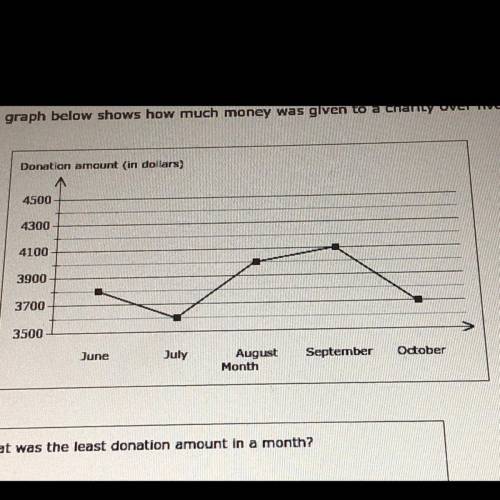
The graph below shows how much money was given to charity over 5 months.
(a) what was the least donation amount in a month?
$ []
(b) when did donations have the greatest increase?
a. June to July
b. July to august
c. august to September
d. September to October

Answers: 1
Another question on Mathematics
Mathematics, 21.06.2019 18:00
Marla bought a book for $12.95, a binder for $3.49, and a backpack for $44.99. the sales tax rate is 6%. find the amount of tax and the total she paid for these items
Answers: 1
Mathematics, 21.06.2019 20:00
Pepe and leo deposits money into their savings account at the end of the month the table shows the account balances. if there pattern of savings continue and neither earns interest nor withdraw any of the money , how will the balance compare after a very long time ?
Answers: 1
Mathematics, 21.06.2019 21:30
In a test for esp (extrasensory perception), the experimenter looks at cards that are hidden from the subject. each card contains either a star, a circle, a wave, a cross or a square.(five shapes) as the experimenter looks at each of 20 cards in turn, the subject names the shape on the card. when the esp study described above discovers a subject whose performance appears to be better than guessing, the study continues at greater length. the experimenter looks at many cards bearing one of five shapes (star, square, circle, wave, and cross) in an order determined by random numbers. the subject cannot see the experimenter as he looks at each card in turn, in order to avoid any possible nonverbal clues. the answers of a subject who does not have esp should be independent observations, each with probability 1/5 of success. we record 1000 attempts. which of the following assumptions must be met in order to solve this problem? it's reasonable to assume normality 0.8(1000), 0.2(1000)%30 approximately normal 0.8(1000), 0.2(1000)% 10 approximately normal srs it is reasonable to assume the total number of cards is over 10,000 it is reasonable to assume the total number of cards is over 1000
Answers: 1
You know the right answer?
The graph below shows how much money was given to charity over 5 months.
(a) what was the least do...
Questions

Mathematics, 13.10.2020 15:01

History, 13.10.2020 15:01

Computers and Technology, 13.10.2020 15:01
Mathematics, 13.10.2020 15:01

Physics, 13.10.2020 15:01
History, 13.10.2020 15:01
Mathematics, 13.10.2020 15:01
Computers and Technology, 13.10.2020 15:01
Mathematics, 13.10.2020 15:01
Mathematics, 13.10.2020 15:01
English, 13.10.2020 15:01


