
Mathematics, 27.09.2021 19:10 thesusan7494
6.3.4 Journal: Graphs of Exponential Functions
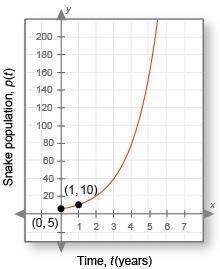
Below is the graph of the boa constrictor population you learned about in the video. The x-axis is t, the time in years, and the y-axis is p(t), the snake population for any given year. In this case, t = 0 indicates the year they started keeping track of the constrictor population. Scientists want to know how the population is changing every two years so they can make predictions about the future.
Analyzing the Data:
1. Is this graph increasing or decreasing? Does this imply that the boa constrictor population is growing or diminishing? (1 point)
2. Looking at this graph, would you agree that the boa constrictor population could become a problem? (1 point)
3. What is the horizontal asymptote of this graph? (1 point)
4. What is the domain? Explain. (1 point)
5. What is the range? Explain. (1 point)
6. What is the y-intercept? What does this mean in terms of the snake population? (1 point)
7. What is the point on the graph when x = 1? What does this mean in terms of the snake population? (1 point)
8. The graph is of a function in the form p(t) = a • bt. What is the function? (2 points)
9. Use this function to estimate the boa constrictor population in 2 years, 3 years, and 4 years. (6 points: 2 points for each year, including 1 point for showing your work and 1 point for the answer)
10. What pattern do you see in years 2, 3, and 4? How is the snake population changing every year? (2 points)
11. How is the snake population changing every two years? (1 point)
Making a Decision:
12. Do you think the snake population can continue to grow in this way forever? Why or why not? (2 points)

Answers: 2
Another question on Mathematics
Mathematics, 21.06.2019 20:00
Marcus and cody both leave the park at the same time, but in opposite directions. if cody travels 6 mph faster than marcus and after 4 hours they are 64 miles apart, how fast is each traveling? solve using rare times time = distance.
Answers: 1
Mathematics, 21.06.2019 23:00
The equation represents the function f, and the graph represents the function g. f(x)=3(5/2)^x determine the relationship between the growth factors of f and g. a. the growth factor of g is twice the growth factor of f. b. the growth factor of f is twice the growth factor of g. c. the growth factor of f is 2.5 times the growth factor of g. d. the growth factor of f is the same as the growth factor of g.
Answers: 3
Mathematics, 21.06.2019 23:00
In an equilateral triangle, each angle is represented by 5y+3. what is the value of y? a. 9.7 b. 10.8 c. 11.4 d. 7.2
Answers: 1
Mathematics, 21.06.2019 23:00
George writes the mixed number as sum and uses the distributive property 1/2.-2/5=1/2-2+2/5=1/2
Answers: 1
You know the right answer?
6.3.4 Journal: Graphs of Exponential Functions
Below is the graph of the boa constrictor populatio...
Questions
Mathematics, 10.04.2021 14:00

Law, 10.04.2021 14:00

Health, 10.04.2021 14:00

Physics, 10.04.2021 14:00

Geography, 10.04.2021 14:00

Business, 10.04.2021 14:00

Social Studies, 10.04.2021 14:00


History, 10.04.2021 14:00

Physics, 10.04.2021 14:00
Mathematics, 10.04.2021 14:00
History, 10.04.2021 14:00
Physics, 10.04.2021 14:00

Biology, 10.04.2021 14:00


