
Which of the following scenarios could produce the graph shown above?
A)
The number of heads...

Mathematics, 30.09.2021 16:40 1937
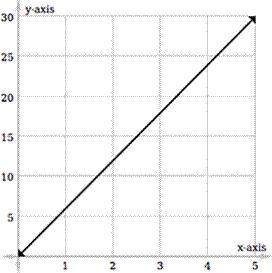
Which of the following scenarios could produce the graph shown above?
A)
The number of heads when flipping a coin
B)
The price of strawberries per pound
C)
The number of members in a band
D)
The number of students in a classroom

Answers: 3
Another question on Mathematics
Mathematics, 21.06.2019 12:50
Pepe is going to spin the following spinner 800 times. the spinner is divided into equal sections.a. exactly 160 timesb. clost to 160 times but probably not exactly 160 timesc. exactly 640 timesd. close to 640 times but not probably not exactly 640 times. me
Answers: 3
Mathematics, 21.06.2019 19:30
Complete the solution of the equation. find the value of y when x equals to 28 x+3y=28
Answers: 2
Mathematics, 21.06.2019 22:30
Ingredient c: 1/4 cup for 2/3 serving or ingredient d: 1/3 cup for 3/4 serving which unit rate is smaller
Answers: 2
Mathematics, 22.06.2019 00:20
Find the power set of each of these sets, where a and b are distinct elements. a) {a} b) {a, b} c) {1, 2, 3, 4} show steps
Answers: 1
You know the right answer?
Questions

Mathematics, 18.03.2021 03:10


Mathematics, 18.03.2021 03:10
English, 18.03.2021 03:10
Mathematics, 18.03.2021 03:10
English, 18.03.2021 03:10

History, 18.03.2021 03:10
Mathematics, 18.03.2021 03:10

Arts, 18.03.2021 03:10


