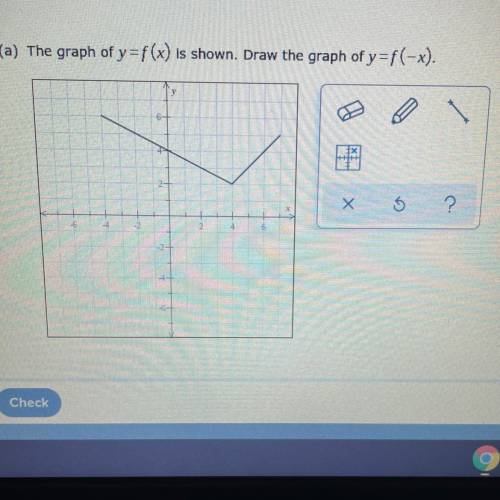
The graph of y=f(x) is shown. Draw the graph of y=f(-x).
...

Mathematics, 08.10.2021 19:20 batmandillon21
The graph of y=f(x) is shown. Draw the graph of y=f(-x).

Answers: 1
Another question on Mathematics
Mathematics, 21.06.2019 16:00
Use set buikder notation to represent the following set: {, -2, -1, 0}
Answers: 1
Mathematics, 21.06.2019 20:30
Elizabeth claims that the fourth root of 2 can be expressed as 2^m since (2^m)^n = 2. find the values of m and n for the case where elizabeth's claim is true.
Answers: 3
You know the right answer?
Questions


