
Mathematics, 10.10.2021 19:00 isabellacampos4586
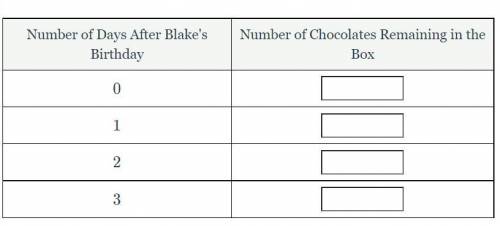
Blake was given a box of assorted chocolates for his birthday. Each night, Blake treated himself to some chocolates. There were originally 24 chocolates in the box and Blake ate 4 chocolates each night. Make a table of values and then write an equation for C, in terms of t, representing the number of chocolates remaining in the box t days after Blake's birthday.

Answers: 2
Another question on Mathematics
Mathematics, 20.06.2019 18:04
Can you draw an isosceles triangle with only one 80 degree angle?
Answers: 1
Mathematics, 21.06.2019 16:00
Part one: measurements 1. measure your own height and arm span (from finger-tip to finger-tip) in inches. you will likely need some from a parent, guardian, or sibling to get accurate measurements. record your measurements on the "data record" document. use the "data record" to you complete part two of this project. name relationship to student x height in inches y arm span in inches archie dad 72 72 ginelle mom 65 66 sarah sister 64 65 meleah sister 66 3/4 67 rachel sister 53 1/2 53 emily auntie 66 1/2 66 hannah myself 66 1/2 69 part two: representation of data with plots 1. using graphing software of your choice, create a scatter plot of your data. predict the line of best fit, and sketch it on your graph. part three: the line of best fit include your scatter plot and the answers to the following questions in your word processing document 1. 1. which variable did you plot on the x-axis, and which variable did you plot on the y-axis? explain why you assigned the variables in that way. 2. write the equation of the line of best fit using the slope-intercept formula $y = mx + b$. show all your work, including the points used to determine the slope and how the equation was determined. 3. what does the slope of the line represent within the context of your graph? what does the y-intercept represent? 5. use the line of best fit to you to describe the data correlation.
Answers: 2
Mathematics, 21.06.2019 17:50
The length and width of a rectangle are consecutive even integers the area of the rectangle is 120 squares units what are the length and width of the rectangle
Answers: 1
Mathematics, 21.06.2019 19:00
Billy plotted −3 4 and −1 4 on a number line to determine that −3 4 is smaller than −1 4 .is he correct? explain why or why not
Answers: 3
You know the right answer?
Blake was given a box of assorted chocolates for his birthday. Each night, Blake treated himself to...
Questions
Mathematics, 04.02.2021 14:00

English, 04.02.2021 14:00
English, 04.02.2021 14:00
Mathematics, 04.02.2021 14:00

Chemistry, 04.02.2021 14:00
Chemistry, 04.02.2021 14:00
Chemistry, 04.02.2021 14:00
Mathematics, 04.02.2021 14:00
Mathematics, 04.02.2021 14:00
English, 04.02.2021 14:00

Social Studies, 04.02.2021 14:00
Mathematics, 04.02.2021 14:00


