
Mathematics, 26.10.2021 18:00 blakestuhan
( sorry for the wired question )
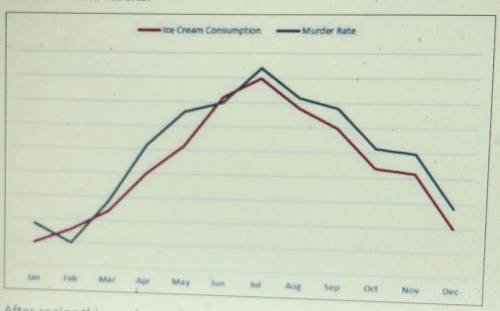
researchers in New York city did a study on ice cream sales and murder rates in the city. this graph was included in the results
after seeing this graph as a picture with the headline "ice cream sales causes murder rates to increase" shared on social media by her best friend's second cousin, the president of a prominent HOA in the Hamptons decided to petition to ban the sale of ice cream so that people would stop being murdered .
this is the question - compare and contrast what you see on the graph.
second part to the question - was the HOA president right for doing so ? what other factors could have contributed to both the rise in ice cream sales and murders? is this an example of correlation or causation?

Answers: 1
Another question on Mathematics
Mathematics, 21.06.2019 17:30
Hiroaki wants to find 3 3/4 - 7/8 explain why he must rename 3 3/4 to do the subtraction.
Answers: 3
Mathematics, 22.06.2019 03:00
Which is the factored form of the polynomial p(x) shown here?
Answers: 1
Mathematics, 22.06.2019 03:30
Identify the number as a rational or irrational.explai. 291.87
Answers: 2
You know the right answer?
( sorry for the wired question )
researchers in New York city did a study on ice cream sales and m...
Questions

Biology, 14.02.2022 22:50
Mathematics, 14.02.2022 22:50
Mathematics, 14.02.2022 22:50

English, 14.02.2022 22:50

Chemistry, 14.02.2022 22:50

Advanced Placement (AP), 14.02.2022 22:50

Mathematics, 14.02.2022 22:50
Mathematics, 14.02.2022 22:50
Mathematics, 14.02.2022 22:50
Mathematics, 14.02.2022 22:50


