
Mathematics, 02.12.2021 01:50 lululoveee3433
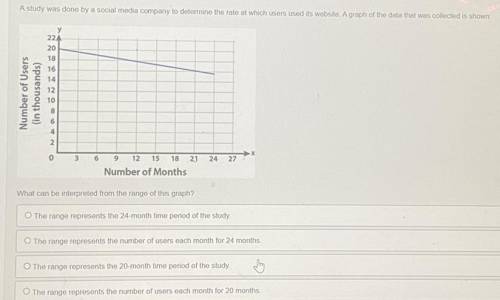
A study was done by a social media company to determino tho rato at which users used its website. A graph of the data that was collected is shown
у
22A
20
18
16
14
12
10
Number of Users
(in thousands)
ONARI
3
24
27
6 9 12 15 18 21
Number of Months
What can be interpreted from the range of this graph?
O The range represents the 24-month time period of the study
The range represents the number of users each month for 24 months
The range represents the 20-month time period of the study
The range represents the number of users each month for 20 months

Answers: 3
Another question on Mathematics
Mathematics, 21.06.2019 19:00
The reflexive property of congruence lets you say that ∠pqr ≅
Answers: 1
Mathematics, 21.06.2019 21:30
Ebuka's monthly rent is $750. if ebuka pays the rent late, his landlord charges 4% interest per week that the payment is late. write a function that gives the total cost r(t), in dollars, of ebuka's rent if he pays it t weeks late.
Answers: 1
Mathematics, 22.06.2019 02:30
The upcoming championship high school football game is a big deal in your little town. the problem is, it is being played in the next biggest town, which is two hours away! to get as many people as you can to attend the game, you decide to come up with a ride-sharing app, but you want to be sure it will be used before you put all the time in to creating it. you determine that if more than three students share a ride, on average, you will create the app. you conduct simple random sampling of 20 students in a school with a population of 300 students to determine how many students are in each ride-share (carpool) on the way to school every day to get a good idea of who would use the app. the following data are collected: 6 5 5 5 3 2 3 6 2 2 5 4 3 3 4 2 5 3 4 5 construct a 95% confidence interval for the mean number of students who share a ride to school, and interpret the results. part a: state the parameter and check the conditions. part b: construct the confidence interval. be sure to show all your work, including the degrees of freedom, critical value, sample statistics, and an explanation of your process. part c: interpret the meaning of the confidence interval. part d: use your findings to explain whether you should develop the ride-share app for the football game.
Answers: 3
Mathematics, 22.06.2019 07:40
Which of these measurements is aboutthe same as 100 inches? a 10 centimetersb 250 centimetersc 6 metersd 30 meterswhich of these is the same as thenumber in the place-value chart? 1,000s | 100s 110s 1141 91 0a 1,994b 1,000 + 900 + 40cone thousand nine hundred fod 1 thousand 9 hundreds 4 tenswhich group of numbers is missingfrom this number pattern? 8, 12, 16, 32f 17, 18, 19g 17, 20, 23i 20, 24, 2822, 26, 30what number is missing from tnumber pattern? 20, 16, 18, 14, 16, -, 14, 10f 12g 15h 17j 18
Answers: 3
You know the right answer?
A study was done by a social media company to determino tho rato at which users used its website. A...
Questions


English, 13.11.2020 03:20


Chemistry, 13.11.2020 03:20
History, 13.11.2020 03:20
Mathematics, 13.11.2020 03:20

Arts, 13.11.2020 03:20

Biology, 13.11.2020 03:20
Biology, 13.11.2020 03:20
History, 13.11.2020 03:20

Physics, 13.11.2020 03:20

Business, 13.11.2020 03:20


