
Mathematics, 03.12.2021 04:10 BREBRE8932
Need really bad pls help!
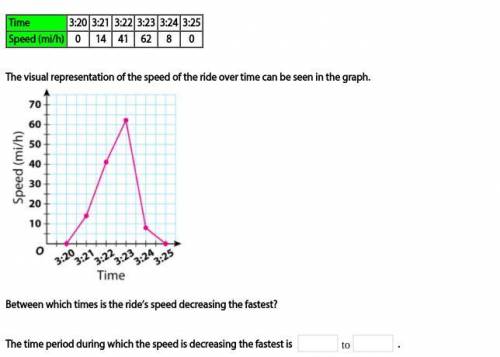
The data in the table shows the speed of a ride at an amusement park at different times one afternoon.
Time 3:20 3:21 3:22 3:23 3:24 3:25
Speed (mi/h) 0 14 41 62 8 0
The visual representation of the speed of the ride over time can be seen in the graph.
Between which times is the ride’s speed decreasing the fastest?
The time period during which the speed is decreasing the fastest is .

Answers: 2
Another question on Mathematics
Mathematics, 21.06.2019 17:30
Aplot of land is shaped like a quadrilateral. fences are built on the diagonal to divide the area into 4 sections. what is vi to the nearest tenth? gv = 6.55fv = 5.84vh = 3.27vi = ?
Answers: 1
Mathematics, 21.06.2019 20:10
21 type the correct answer in the box. use numerals instead of words. if necessary, use / for the fraction bar. the solution set of n2 - 14n = -45 is { (separate the solutions with a comma)
Answers: 3
Mathematics, 21.06.2019 23:00
Unaware that 35% of the 10000 voters in his constituency support him, a politician decides to estimate his political strength. a sample of 200 voters shows that 40% support him. a. what is the population? b. what is the parameter of interest? state its value c. what is the statistics of the interest? state its value d. compare your answers in (b) and (c) is it surprising they are different? if the politician were to sample another 200 voters, which of the two numbers would most likely change? explain
Answers: 2
Mathematics, 22.06.2019 01:10
Stefania pours 2 liters of orange juice and 1.5 liters of pineapple juice into a punch bowl. how many liters are in the punch bowl?
Answers: 1
You know the right answer?
Need really bad pls help!
The data in the table shows the speed of a ride at an amusement park at...
Questions


Mathematics, 11.03.2020 23:07

Computers and Technology, 11.03.2020 23:07


