
Mathematics, 15.12.2021 17:30 Hellokittyjam35
Question 8 (1 point)
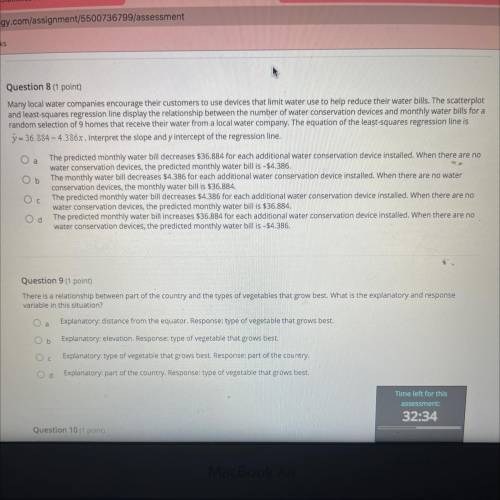
Many local water companies encourage their customers to use devices that limit water use to help reduce their water bills. The scatterplot
and least-squares regression line display the relationship between the number of water conservation devices and monthly water bills for a
random selection of 9 homes that receive their water from a local water company. The equation of the least-squares regression line is
9-36.884-4.386x. Interpret the slope and y intercept of the regression line.
Oa
Ob
Ос
The predicted monthly water bill decreases $36.884 for each additional water conservation device installed. When there are no
water conservation devices, the predicted monthly water bill is-$4.386.
The monthly water bill decreases $4.386 for each additional water conservation device installed. When there are no water
conservation devices, the monthly water bill is $36.884.
The predicted monthly water bill decreases $4.386 for each additional water conservation device installed. When there are no
water conservation devices, the predicted monthly water bill is $36.884.
The predicted monthly water bill increases $36.884 for each additional water conservation device installed. When there are no
water conservation devices, the predicted monthly water billis -$4.386.
Od

Answers: 1
Another question on Mathematics
Mathematics, 21.06.2019 17:30
Nick and nora are married and have three children in college. they have an adjusted gross income of 47,400. if their standard deduction is 12,600 itemized deductions are 14,200 and they get an exemption of 4000 for each adult and each dependent what is their taxable income
Answers: 3
Mathematics, 21.06.2019 18:30
Two angles are complementary. the large angle is 36 more than the smaller angle. what is the measure of the large angle?
Answers: 1
Mathematics, 21.06.2019 19:30
Need now max recorded the heights of 500 male humans. he found that the heights were normally distributed around a mean of 177 centimeters. which statements about max’s data must be true? a) the median of max’s data is 250 b) more than half of the data points max recorded were 177 centimeters. c) a data point chosen at random is as likely to be above the mean as it is to be below the mean. d) every height within three standard deviations of the mean is equally likely to be chosen if a data point is selected at random.
Answers: 1
Mathematics, 22.06.2019 02:30
Build is 120 wide 20 feet high 48 feet long how many cubic feet and the volume
Answers: 1
You know the right answer?
Question 8 (1 point)
Many local water companies encourage their customers to use devices that limi...
Questions
Mathematics, 25.11.2021 15:30

History, 25.11.2021 15:30
Mathematics, 25.11.2021 15:30

Biology, 25.11.2021 15:30

English, 25.11.2021 15:30
English, 25.11.2021 15:30
English, 25.11.2021 15:30
Mathematics, 25.11.2021 15:30
Mathematics, 25.11.2021 15:30

Spanish, 25.11.2021 15:30

Advanced Placement (AP), 25.11.2021 15:30
Mathematics, 25.11.2021 15:30

Mathematics, 25.11.2021 15:30
Chemistry, 25.11.2021 15:30

Physics, 25.11.2021 15:30


