
Mathematics, 17.12.2021 05:20 jescanarias22
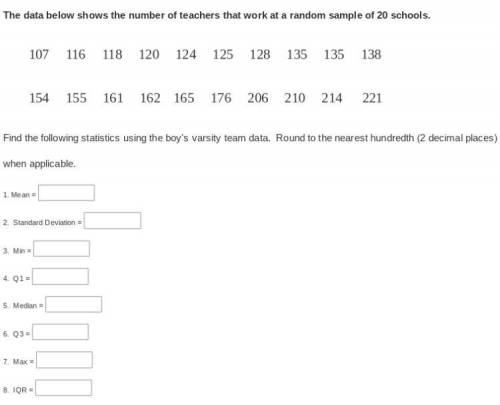
The data below shows the number of teachers that work at a random sample of 20 schools.
107, 116, 118, 120, 124, 125, 128, 135, 135, 138, 154, 155, 161, 162, 165, 176, 206, 210, 214, 221
Find the following statistics using the boy’s varsity team data. Round to the nearest hundredth (2 decimal places) when applicable.
1. Mean =
2. Standard Deviation =
3. Min =
4. Q1 =
5. Median =
6. Q3 =
7. Max =
8. IQR =

Answers: 3
Another question on Mathematics
Mathematics, 21.06.2019 13:10
What is the smallest integer n such that n\sqrt{2} is greater than 20
Answers: 2
Mathematics, 21.06.2019 14:00
The axis of symmetry for the graph of the function f(x)=1/4^2+bx +10 is x=6. what is the value of b?
Answers: 1
Mathematics, 21.06.2019 14:10
You invested $5000 between two accounts paying 4% and 9% annual interest, respectively. if the total interest earned for theyear was $350, how much was invested at each rate? $was invested at 4% andwas invested at 9%.
Answers: 3
Mathematics, 21.06.2019 21:00
A25- foot ladder leans against a building and reaches a point of 23.5 feet above the ground .find the angle that the ladder makes with the building
Answers: 2
You know the right answer?
The data below shows the number of teachers that work at a random sample of 20 schools.
107, 116,...
Questions

Chemistry, 17.09.2021 08:30


Mathematics, 17.09.2021 08:30

History, 17.09.2021 08:30

Mathematics, 17.09.2021 08:30

Spanish, 17.09.2021 08:30
Chemistry, 17.09.2021 08:40
Mathematics, 17.09.2021 08:40
Chemistry, 17.09.2021 08:40

World Languages, 17.09.2021 08:40

Mathematics, 17.09.2021 08:40

History, 17.09.2021 08:40

Computers and Technology, 17.09.2021 08:40


