Which problem could be modeled by the graph shown below?
John's Savings
у
50
45<...

Mathematics, 18.01.2022 14:00 angrybirdsryver
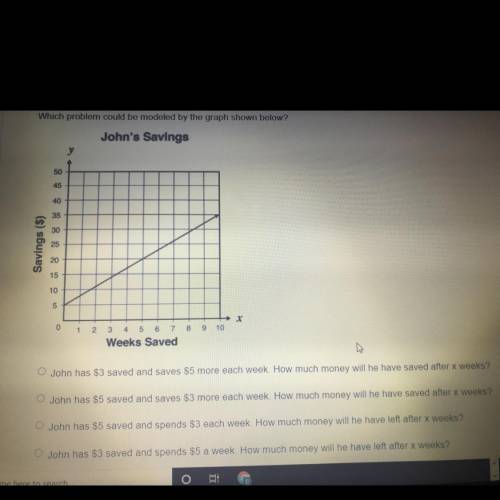
Which problem could be modeled by the graph shown below?
John's Savings
у
50
45
40
35
30
Savings ($)
25
20
15
10
5
0
1
3
9
10
4 5 6 7 8
Weeks Saved
John has $3 saved and saves $5 more each week. How much money will he have saved after x weeks?
John has $5 saved and saves $3 more each week. How much money will he have saved after x weeks?
John has $5 saved and spends $3 each week. How much money will he have left after x weeks?
John has $3 saved and spends $5 a week. How much money will he have left after x weeks?

Answers: 3
Another question on Mathematics
Mathematics, 21.06.2019 15:30
Afruit stand has to decide what to charge for their produce. they need $10 for 4 apples and 4 oranges. they also need $15 for 6 apples and 6 oranges. we put this information into a system of linear equations. can we find a unique price for an apple and an orange?
Answers: 2
Mathematics, 21.06.2019 23:00
Which of the following graphs could represent a cubic function?
Answers: 1
You know the right answer?
Questions


Mathematics, 10.03.2020 05:32

Computers and Technology, 10.03.2020 05:32
Mathematics, 10.03.2020 05:32
Mathematics, 10.03.2020 05:32
Mathematics, 10.03.2020 05:33
Mathematics, 10.03.2020 05:33

Mathematics, 10.03.2020 05:34


