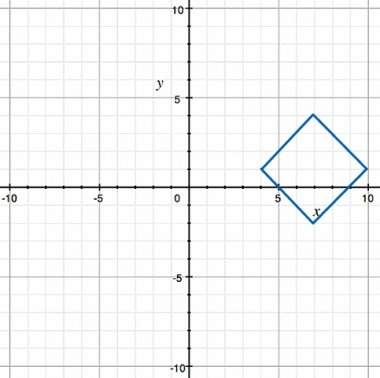
subject
Mathematics, 14.02.2022 16:00 mauifrifer3986

Barometric Wind
Pressure (mb) (x) Speed (mph) (y)
1010
35
1000
40
1000
52
997
64
983
80
970
100
952
112
932
148
910
168
(a) Use the data in the table to find the least-squares regression line. Round the slope to two decimal places and the y-intercept to
the nearest whole unit.
(b) Use a graphing utility to graph the regression line and the observed data, then choose the correct graph from the options
below.
(©) Use the model in part (a) to approximate the wind speed of a hurricane with barometric pressure of 930 mb. Round to the
nearest mph.
Part: 0/3
Part 1 of 3
(a) Use the data in the table to find the least-squares regression line. Round the slope to two decimal places and the y-
intercept to the nearest whole unit.
The equation for the least-squares regression line is y=


Barometric

Wind
Pressure (mb) (x) Speed (mph) (y)
1010
35
1000
40
1000
52
997
64
983
80
970
100
9

ansver
Answers: 1

Another question on Mathematics

question
Mathematics, 21.06.2019 15:00
Idon’t understand this.. will someone ? will mark brainliest along with 20 points.
Answers: 2
question
Mathematics, 21.06.2019 20:00
The function f(x) = 14,600(1.1)* represents the population of a town x years after it was established. what was the original population of the town?
Answers: 1
question
Mathematics, 22.06.2019 03:30
What is the benefit of converting measures in a ratio to the same unit
Answers: 1
question
Mathematics, 22.06.2019 03:30
Graph the linear equation find three points on the graph -x+2y=11
Answers: 2
You know the right answer?
Barometric Wind
Pressure (mb) (x) Speed (mph) (y)
1010
35
1000
40
Questions
Questions on the website: 13722367