
Mathematics, 06.03.2022 05:40 Penelope9687
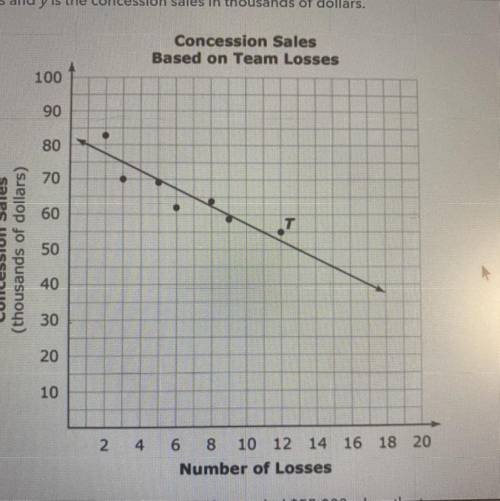
The business manager for the local baseball team uses a scatter plot to show that as the team's losses increase the sales in concessions decrease. The equation of the line of best fit for his data is y = -2.5x + 82.5, where x is the number of losses and y is the concession sales in thousands of dollars. Point t shows that the concession sales totaled $55,000 when the team experienced its 12th loss. Which is the value of the residual at this data point?

Answers: 3
Another question on Mathematics
Mathematics, 21.06.2019 18:00
The sat and act tests use very different grading scales. the sat math scores follow a normal distribution with mean 518 and standard deviation of 118. the act math scores follow a normal distribution with mean 20.7 and standard deviation of 5. suppose regan scores a 754 on the math portion of the sat. how much would her sister veronica need to score on the math portion of the act to meet or beat regan's score?
Answers: 1
Mathematics, 21.06.2019 23:00
Siri can type 90 words in 40 minutes about how many words would you expect her to type in 10 minutes at this rate
Answers: 1
Mathematics, 22.06.2019 02:00
Select the correct answer. which exponential function has an x-intercept? oa. (x) - 100x-5-1 ob. (x) = 3x4+2 oc. kx) = 7x-1 + 1 od. 1(x) =-3x+1 - 3
Answers: 1
Mathematics, 22.06.2019 02:00
1. the manager of collins import autos believes the number of cars sold in a day (q) depends on two factors: (1) the number of hours the dealership is open (h) and (2) the number of salespersons working that day (s). after collecting data for two months (53 days), the manager estimates the following log-linear model: q 4 equation 1 a. explain, how to transform the log-linear model into linear form that can be estimated using multiple regression analysis. the computer output for the multiple regression analysis is shown below: q4 table b. how do you interpret coefficients b and c? if the dealership increases the number of salespersons by 20%, what will be the percentage increase in daily sales? c. test the overall model for statistical significance at the 5% significance level. d. what percent of the total variation in daily auto sales is explained by this equation? what could you suggest to increase this percentage? e. test the intercept for statistical significance at the 5% level of significance. if h and s both equal 0, are sales expected to be 0? explain why or why not? f. test the estimated coefficient b for statistical significance. if the dealership decreases its hours of operation by 10%, what is the expected impact on daily sales?
Answers: 2
You know the right answer?
The business manager for the local baseball team uses a scatter plot to show that as the team's loss...
Questions
Mathematics, 10.12.2020 20:30
Mathematics, 10.12.2020 20:30

Mathematics, 10.12.2020 20:30


Social Studies, 10.12.2020 20:30
Social Studies, 10.12.2020 20:30

Mathematics, 10.12.2020 20:30
History, 10.12.2020 20:30
Social Studies, 10.12.2020 20:30
Mathematics, 10.12.2020 20:30
Mathematics, 10.12.2020 20:30
Mathematics, 10.12.2020 20:30

Computers and Technology, 10.12.2020 20:30
Mathematics, 10.12.2020 20:30


