
Mathematics, 13.03.2022 15:50 jennychrin95
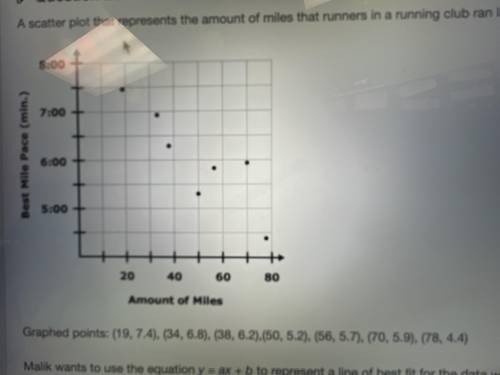
A scatter plot that represents the amount of miles that runners in a running club ran last week as well as their best mile time is shown below
Graphed points: (19,7.4),(34,6.8),(38,6.2),(50,5.2) ,(56,5.7),(70,5.9),(78,4.4)
Malik wants to use the equation y=ax+b to represent a line of best fit for the data where x represents the amount of miles ran last week and y represents the best mile pace (in minutes). He wants to determine a line of best fit in order to estimate best mile paces for other runners.
Complete the table to determine which values should be used for a and b


Answers: 2
Another question on Mathematics
Mathematics, 21.06.2019 19:30
Select the margin of error that corresponds to the sample mean that corresponds to each population: a population mean of 25, a standard deviation of 2.5, and margin of error of 5%
Answers: 2
Mathematics, 21.06.2019 20:00
Beth divided 9 ounces of her granola recipe into 4 equal-sized amounts. she placed the amounts into individual bowls. the fraction 9/4 represents the number of ounces of granola in each bowl. which other number represents the amount of granola beth has in each bowl? (a) 1 1/4 (b) 2 1/4 (c) 1 3/4 (d) 3 3/4 i need !
Answers: 2
Mathematics, 22.06.2019 00:00
Use the given information to determine the exact trigonometric value.
Answers: 3
You know the right answer?
A scatter plot that represents the amount of miles that runners in a running club ran last week as w...
Questions

History, 13.01.2020 16:31
Mathematics, 13.01.2020 16:31

Mathematics, 13.01.2020 16:31
Mathematics, 13.01.2020 16:31


Chemistry, 13.01.2020 16:31
Mathematics, 13.01.2020 16:31
Mathematics, 13.01.2020 16:31

English, 13.01.2020 16:31
Chemistry, 13.01.2020 16:31

Geography, 13.01.2020 16:31
Biology, 13.01.2020 16:31


