
Mathematics, 05.07.2019 14:50 KindaSmartPersonn
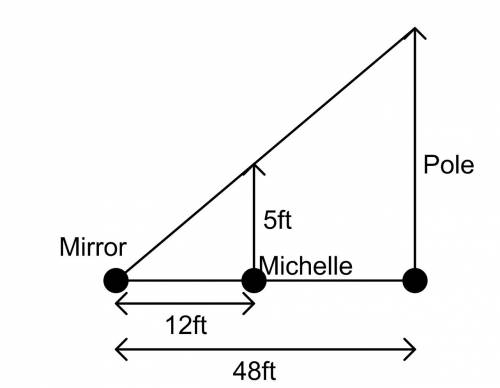
Michele wanted to measure the height of her school’s flagpole. she placed a mirror on the ground 48 feet from the flagpole, then walked backwards until she was able to see the top of the pole in the mirror. her eyes were 5 feet above the ground and she was 12 feet from the mirror. using similar triangles, find the height of the flagpole to the nearest tenth of a foot. find the geometric mean of the pair of numbers. a. 20 ft b. 38.4 ft c. 55 ft d. 25 ft

Answers: 1
Another question on Mathematics
Mathematics, 21.06.2019 18:00
If f(x) = 4x – 3 and g(x) = 8x + 2, find each function value a.f[g(3)] b.g[f(5)] c.g{f[g(-4)]}
Answers: 3
Mathematics, 22.06.2019 00:00
Can someone plz me understand how to do these. plz, show work.in exercises 1-4, rewrite the expression in rational exponent form.[tex]\sqrt[4]{625} \sqrt[3]{512} (\sqrt[5]{4} )³ (\sqrt[4]{15} )^{7}\\ (\sqrt[3]{27} )^{2}[/tex]
Answers: 3
Mathematics, 22.06.2019 01:10
"curse these trig-loving pirates! " devora mutters as she looks at the map. then, after thinking for a moment, she walks back to the entrance of the secret cave, measuring 48 meters along the way. after performing a calculation, devora walks back to the empty treasure, faces the entrance, and turns a certain number of degrees to her left before walking 89 meters to the treasure. supposing that the angle at the cave entrance is acute and that devora's calculations were correct, how many degrees did she turn?
Answers: 2
Mathematics, 22.06.2019 02:00
1. the manager of collins import autos believes the number of cars sold in a day (q) depends on two factors: (1) the number of hours the dealership is open (h) and (2) the number of salespersons working that day (s). after collecting data for two months (53 days), the manager estimates the following log-linear model: q 4 equation 1 a. explain, how to transform the log-linear model into linear form that can be estimated using multiple regression analysis. the computer output for the multiple regression analysis is shown below: q4 table b. how do you interpret coefficients b and c? if the dealership increases the number of salespersons by 20%, what will be the percentage increase in daily sales? c. test the overall model for statistical significance at the 5% significance level. d. what percent of the total variation in daily auto sales is explained by this equation? what could you suggest to increase this percentage? e. test the intercept for statistical significance at the 5% level of significance. if h and s both equal 0, are sales expected to be 0? explain why or why not? f. test the estimated coefficient b for statistical significance. if the dealership decreases its hours of operation by 10%, what is the expected impact on daily sales?
Answers: 2
You know the right answer?
Michele wanted to measure the height of her school’s flagpole. she placed a mirror on the ground 48...
Questions
Mathematics, 17.12.2021 08:10


Health, 17.12.2021 08:10

Physics, 17.12.2021 08:10
Chemistry, 17.12.2021 08:10
Mathematics, 17.12.2021 08:10
Mathematics, 17.12.2021 08:20
Mathematics, 17.12.2021 08:20
Mathematics, 17.12.2021 08:20
Chemistry, 17.12.2021 08:20
Mathematics, 17.12.2021 08:20
Mathematics, 17.12.2021 08:20

Mathematics, 17.12.2021 08:20


