
Mathematics, 05.07.2019 19:40 brayannnnn36781
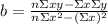
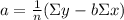
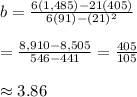
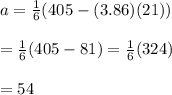
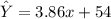
Using simple linear regression, calculate the trend line for the historical data. say the x axis is april = 1, may = 2, and so on, while the y axis is demand. (round your intercept value to the nearest whole number and slope value to 2 decimal places.

Answers: 1
![\begin{tabular} {|c|c|} &Demand\\[1ex] April&60\\ May&55\\ June&75\\July&60\\August&80\\September&75\\ \end{tabular}](/tpl/images/0055/2053/78ffe.png)

![\begin{tabular} {|c|c|c|c|} X &Y&X^2&XY\\[1ex] 1&60&1&60\\ 2&55&4&110\\ 3&75&9&225\\ 4&60&16&240\\ 5&80&25&400\\ 6&75&36&450\\[1ex] \Sigma X=21&\Sigma Y=405&\Sigma X^2=91&\Sigma XY=1,485 \end{tabular}](/tpl/images/0055/2053/0846b.png)
Another question on Mathematics
Mathematics, 21.06.2019 12:30
And explain how you got it so i can understand future problems : 3
Answers: 1
Mathematics, 21.06.2019 15:00
Need ! give step by step solutions on how to solve number one [tex]\frac{9-2\sqrt{3} }{12+\sqrt{3} }[/tex] number two [tex]x+4=\sqrt{13x-20}[/tex] number three (domain and range) [tex]f(x)=2\sqrt[3]{x} +1[/tex]
Answers: 3
Mathematics, 21.06.2019 15:20
Given: f(x) = 2x + 5 and g(x) = x2 and h(x) = -2x h(g(f( = x2+ vx+ x + y
Answers: 3
Mathematics, 21.06.2019 16:00
What is the standard deviation of the following data set rounded to the nearest tenth? 3, 17, 18, 15, 12, 21, 9
Answers: 2
You know the right answer?
Using simple linear regression, calculate the trend line for the historical data. say the x axis is...
Questions
Mathematics, 12.08.2020 08:01


Mathematics, 12.08.2020 08:01
Mathematics, 12.08.2020 08:01
Mathematics, 12.08.2020 08:01
Mathematics, 12.08.2020 08:01
Mathematics, 12.08.2020 08:01

English, 12.08.2020 08:01


