
Mathematics, 26.07.2019 11:40 UndeadDelta
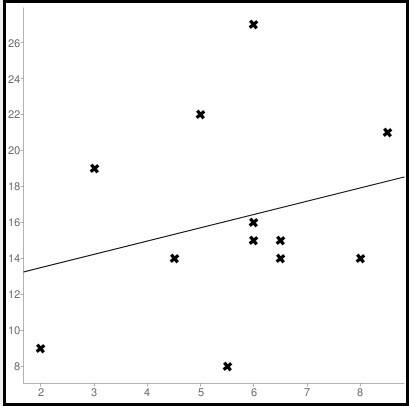
1. the table shows the distances, in meters, that each player in a game tossed a ball, and the total number of earned points each player made for those tosses. distance (m) 6.5 6 5 8.5 2 5.5 6.5 8 3 6 4.5 6 total earned points 15 15 22 21 9 8 14 14 19 27 14 16 (a) create a scatter plot of the data set. use the distance for the input variable and the total earned points for the output variable. (b) are there any clusters or outliers in the data set? if so, identify them.

Answers: 1
Another question on Mathematics
Mathematics, 21.06.2019 20:30
Janet is rolling a number cube with the numbers one through six she record the numbers after each row if she rolls of keep 48 times how many times should she expect to roll a 4
Answers: 1
Mathematics, 21.06.2019 21:30
Students are given 3 minutes to complete each multiple-choice question on a test and 8 minutes for each free-responsequestion. there are 15 questions on the test and the students have been given 55 minutes to complete itwhich value could replace x in the table? 5507-m23-m8(15-m)8(15)-m
Answers: 2
Mathematics, 21.06.2019 22:30
60 musicians applied for a job at a music school. 14 of the musicians play both guitar and drums. what is the probability that the applicant who gets the job plays drums or guitar?
Answers: 1
You know the right answer?
1. the table shows the distances, in meters, that each player in a game tossed a ball, and the total...
Questions


Computers and Technology, 18.01.2020 04:31
Computers and Technology, 18.01.2020 04:31

Business, 18.01.2020 04:31


