Mathematics, 23.10.2019 05:10 tay27831
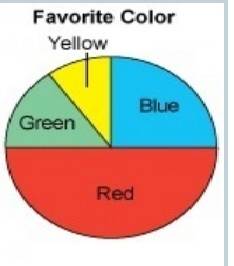
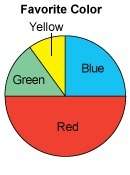
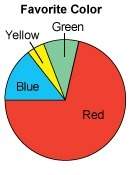
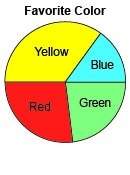
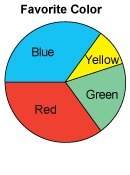
sally surveyed 20 of her friends to determine their favorite color. her data shows that 25% said blue, 15% said green, 10% said yellow, and the rest said red.which circle graph best represents sally's data?


Answers: 3
Another question on Mathematics


Mathematics, 21.06.2019 18:30
You love to play soccer! you make a shot at the net 8 times during a game! of those 8 attempts, you score twice. what percent of the time did you score?
Answers: 2

Mathematics, 21.06.2019 19:00
How many solutions does the nonlinear system of equations graphed bellow have?
Answers: 1
You know the right answer?
sally surveyed 20 of her friends to determine their favorite color. her data shows that 25% said blu...
Questions

Chemistry, 23.05.2020 03:04

Mathematics, 23.05.2020 03:04


Biology, 23.05.2020 03:04


Mathematics, 23.05.2020 03:04


Biology, 23.05.2020 03:04


Law, 23.05.2020 03:57

 ------> Is a quarter of circle
 -----> Is a quarter of circle
 ------> Is a half circle