
Mathematics, 01.08.2019 05:00 liloleliahx2
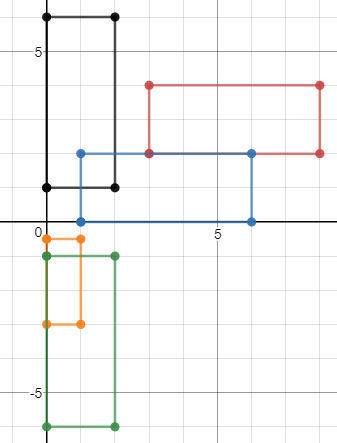
Which graph shows the new position of the rectangle after a translation? rectangle with coordinates: (0, negative 1), (0, negative 6), (2, negative 1), and (2, negative 6). rectangle with coordinates: (0, 1), (0, 6), (2, 1), and (2, 6). rectangle with coordinates: (3, 2), (3, 4), (8, 2), and (8, 4). rectangle with coordinates: (1, 0), (1, 2), (6, 0), and (6, 2). rectangle with coordinates: (0, negative 0.5), (1, negative 0.5), (0, negative 3), and (1, negative 3).

Answers: 1
Another question on Mathematics
Mathematics, 21.06.2019 19:30
Factor the expression using the gcf. the expression 21m−49n factored using the gcf
Answers: 2
Mathematics, 21.06.2019 20:00
Afrequency table of grades has five classes (a, b, c, d, f) with frequencies of 3, 13, 14, 5, and 3 respectively. using percentages, what are the relative frequencies of the five classes?
Answers: 3
Mathematics, 21.06.2019 20:30
Adecibel is a logarithmic unit that can be used to measure the intensity of a sound. the function y = 10logx gives the intensity of a sound in decibels, where x is the ratio of the intensity of the sound to a reference intensity. the reference intensity is generally set at the threshold of hearing. use the graphing utility to graph the decibel function.a whisper has a sound intensity of 30 decibels. use your graph to you complete the following statement. the sound intensity of a whisper is times the reference intensity.
Answers: 1
Mathematics, 21.06.2019 22:00
Percent increase and decrease. original number: 45 new number: 18
Answers: 1
You know the right answer?
Which graph shows the new position of the rectangle after a translation? rectangle with coordinates...
Questions

Mathematics, 08.12.2020 01:00


Chemistry, 08.12.2020 01:00

Mathematics, 08.12.2020 01:00

Mathematics, 08.12.2020 01:00

Mathematics, 08.12.2020 01:00

English, 08.12.2020 01:00
Physics, 08.12.2020 01:00


