2. consider this scatter plot.
(a) how would you characterize the relationship between the hou...

Mathematics, 23.09.2019 16:40 heyItsLuna234
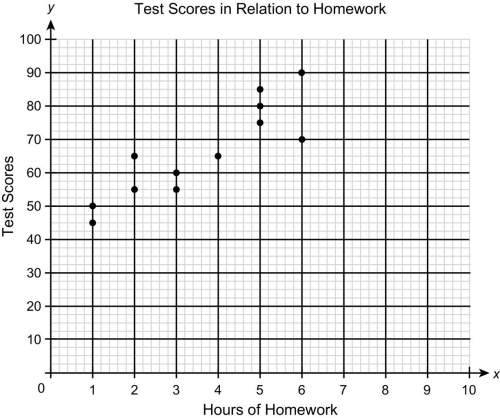
2. consider this scatter plot.
(a) how would you characterize the relationship between the hours spent on homework and the test scores? explain.
(b) paul uses the function y = 8x + 40 to model the situation. what score does the model predict for 3 h of homework?
(c) what does the number 40 in part (b) mean in the context of the situation?

Answers: 1
Another question on Mathematics
Mathematics, 21.06.2019 13:00
Acar traveling at 65 mph leaves 25 foot skid mark what is the ratio of the speed to length of skid mark (feet) in the simplest form
Answers: 1
Mathematics, 21.06.2019 13:30
Two fire-lookout stations are 190 miles apart, with station a directly south of station b. both stations spot a fire. the bearing of the fire from station a is upper n 55 degrees upper e and the bearing of the fire from station b is upper s 60 degrees e. how far, to the nearest tenth of a mile, is the fire from each lookout station?
Answers: 1
Mathematics, 21.06.2019 21:00
Ade and abc are similar. which best explains why the slope of the line between points a and d is the same as the slope between points a and b?
Answers: 2
You know the right answer?
Questions


Physics, 09.07.2019 06:30

Business, 09.07.2019 06:30
Mathematics, 09.07.2019 06:30
Business, 09.07.2019 06:30
Mathematics, 09.07.2019 06:30


English, 09.07.2019 06:30
Mathematics, 09.07.2019 06:30
Mathematics, 09.07.2019 06:30
Mathematics, 09.07.2019 06:30
History, 09.07.2019 06:30

Business, 09.07.2019 06:30
History, 09.07.2019 06:30


