Mathematics, 22.10.2019 04:10 ayoismeisalex
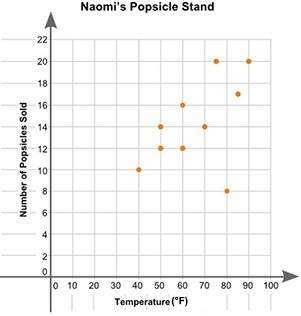
Naomi plotted the graph below to show the relationship between the temperature of her city and the number of popsicles she sold daily:
part a: in your own words, describe the relationship between the temperature of the city and the number of popsicles sold. (2 points)
part b: describe how you can make the line of best fit. write the approximate slope and y-intercept of the line of best fit. show your work, including the points that you use to calculate the slope and y-intercept. (3 points)


Answers: 1
Another question on Mathematics

Mathematics, 21.06.2019 19:00
Samantha is growing a garden in her back yard. she spend $90 setting up the garden bed and buying the proper garden supplies. in addition, each seed she plants cost $0.25. a. write the function f(x) that represents samantha's total cost on her garden. b. explain what x represents. c. explain what f(x) represents. d. if samantha plants 55 seeds, how much did she spend in total?
Answers: 2

Mathematics, 21.06.2019 21:10
What is the domain of the given function? {(3,-2), (6, 1), (-1, 4), (5,9), (-4, 0); o {x | x= -4,-1, 3, 5, 6} o {yl y = -2,0, 1,4,9} o {x|x = -4,-2, -1,0, 1, 3, 4, 5, 6, 9} o y y = 4,-2, -1, 0, 1, 3, 4, 5, 6, 9}
Answers: 1

Mathematics, 22.06.2019 00:00
A6 ounce bottle of dressing costs $1.56 a 14 ounce bottle costs $3.36 a 20 ounce bottle costs $5.60 which has the lowest cost per ounce
Answers: 1

You know the right answer?
Naomi plotted the graph below to show the relationship between the temperature of her city and the n...
Questions


Mathematics, 02.08.2019 17:30


Computers and Technology, 02.08.2019 17:30


History, 02.08.2019 17:30

English, 02.08.2019 17:30

Mathematics, 02.08.2019 17:30


