
The histogram below shows the age distribution of elizabeth’s grandchildren.
the box-an...

Mathematics, 15.01.2020 11:31 milkshakegrande101
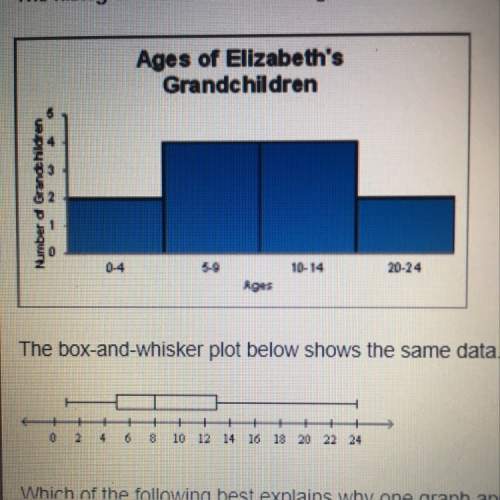
The histogram below shows the age distribution of elizabeth’s grandchildren.
the box-and-whisker plot below shows the same data.
which of the following best explains why one graph appears skewed and one graph appears symmetric?
a. the intervals on the x-adis of the histogram are too large
b. the interval on the y-axis of the histogram is too small
c. the interval on the x-axis of the histogram is inconsistent
d. the interval in the box-and-whisker plot is too small

Answers: 3
Another question on Mathematics
Mathematics, 21.06.2019 15:50
3-12. write each answer with a reasonable number of figures. find the absolute uncertainty and percent relative uncertainty for each answer. (a) [12.41 (±0.09) + 4.16 (±0.01)] x 7.068 2 (±0.000 4) =? (b) [3.26 (±0.10) x 8.47 (±0.05)] - 0.18 (±0.06) =? (c) 6.843 (±0.008) x 104 + [2.09 (±0.04)- 1.63 (±0.01)] =?
Answers: 1
Mathematics, 21.06.2019 16:00
What is the quadric regression equation that fits these data
Answers: 1
Mathematics, 21.06.2019 22:30
Atotal of 766 tickets were sold for the school play. they were either adult tickets or student tickets. there were 66 more student tickets sold than adult tickets. how many adult tickets were sold?
Answers: 1
Mathematics, 21.06.2019 23:30
(c) compare the results of parts (a) and (b). in general, how do you think the mode, median, and mean are affected when each data value in a set is multiplied by the same constant? multiplying each data value by the same constant c results in the mode, median, and mean increasing by a factor of c. multiplying each data value by the same constant c results in the mode, median, and mean remaining the same. multiplying each data value by the same constant c results in the mode, median, and mean decreasing by a factor of c. there is no distinct pattern when each data value is multiplied by the same constant. (d) suppose you have information about average heights of a random sample of airline passengers. the mode is 65 inches, the median is 72 inches, and the mean is 65 inches. to convert the data into centimeters, multiply each data value by 2.54. what are the values of the mode, median, and mean in centimeters? (enter your answers to two decimal places.) mode cm median cm mean cm in this problem, we explore the effect on the mean, median, and mode of multiplying each data value by the same number. consider the following data set 7, 7, 8, 11, 15. (a) compute the mode, median, and mean. (enter your answers to one (1) decimal places.) mean value = median = mode = (b) multiply 3 to each of the data values. compute the mode, median, and mean. (enter your answers to one (1) decimal places.) mean value = median = mode = --
Answers: 1
You know the right answer?
Questions
Mathematics, 24.11.2019 21:31


Social Studies, 24.11.2019 21:31

English, 24.11.2019 21:31
Mathematics, 24.11.2019 21:31
English, 24.11.2019 21:31
History, 24.11.2019 21:31

Chemistry, 24.11.2019 21:31
English, 24.11.2019 21:31
History, 24.11.2019 21:31

Mathematics, 24.11.2019 21:31
Mathematics, 24.11.2019 21:31
History, 24.11.2019 21:31

Health, 24.11.2019 21:31
History, 24.11.2019 21:31


