
Mathematics, 29.07.2019 12:00 liamgreene90
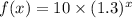
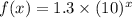
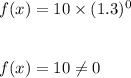
The number of members f(x) in a local swimming club increased by 30% every year over a period of x years. the function below shows the relationship between f(x) and x: f(x) = 10(1.3)x which of the following graphs best represents the function? graph of f of x equals 1.3 multiplied by 10 to the power of x graph of exponential function going up from left to right in quadrant 1 through the point 0, 0 and continuing towards infinity graph of f of x equals 10 multiplied by 1.3 to the power of x graph of f of x equals 1.3 to the power of x

Answers: 1

Another question on Mathematics
Mathematics, 21.06.2019 17:00
Describe what moves you could use to create the transformation of the original image shown at right
Answers: 1
Mathematics, 21.06.2019 19:00
What is the expression in factored form? 3x^2 + 18x + 24 a. 3(x+2)(x+4) b. 3(x-2)(x+4) c. 3(x-2)(x-4) d. 3(x+2)(x-4)
Answers: 2
You know the right answer?
The number of members f(x) in a local swimming club increased by 30% every year over a period of x y...
Questions


Computers and Technology, 20.03.2020 06:04


Mathematics, 20.03.2020 06:05
Mathematics, 20.03.2020 06:05


