
Mathematics, 27.12.2019 01:31 justinbailey96
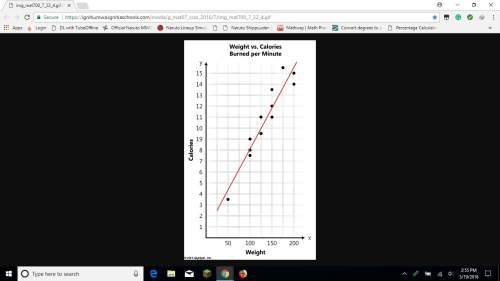
The following scatter plot represents the relationship between a person's weight and the number of calories the person burns in one minute of jump roping.
using the line of best fit, about what weight would a person be if they burned 15 calories per minute?
125 lbs.
150 lbs.
180 lbs.
220 lbs.

Answers: 1
Another question on Mathematics
Mathematics, 21.06.2019 17:00
Solve with work adding cheese to a mcdonalds quarter pounder increases the fat content from 21g to 30g. what is the percent of change ?
Answers: 2
Mathematics, 21.06.2019 22:40
Suppose you are choosing a 6-digit personal access code. this code is made up of 4 digits chosen from 1 to 9, followed by 2 letters chosen from a to z. any of these digits or letters can be repeated. find the total number of personal access codes that can be formed. 492,804 341,172 39,917,124 4,435,236
Answers: 1
Mathematics, 22.06.2019 02:30
Write a ratio and a percent for the shaded area. it is 3x3 and 5x5 grid there is 6 shaded out of a. 6 over 25 , 30% b. 3 over 50 , 6% c.6 over 25 , 24% d. 3 over 10 , 30%
Answers: 1
Mathematics, 22.06.2019 04:00
If the equation of a perpendicular bisector of a triangle is y = 2x + 7, what is the slope of the side that it is bisecting? explain how you know.
Answers: 1
You know the right answer?
The following scatter plot represents the relationship between a person's weight and the number of c...
Questions

History, 17.12.2020 21:40

Social Studies, 17.12.2020 21:40
Mathematics, 17.12.2020 21:40

Health, 17.12.2020 21:40
Mathematics, 17.12.2020 21:40

Biology, 17.12.2020 21:40
Mathematics, 17.12.2020 21:40
Mathematics, 17.12.2020 21:40


Physics, 17.12.2020 21:40


